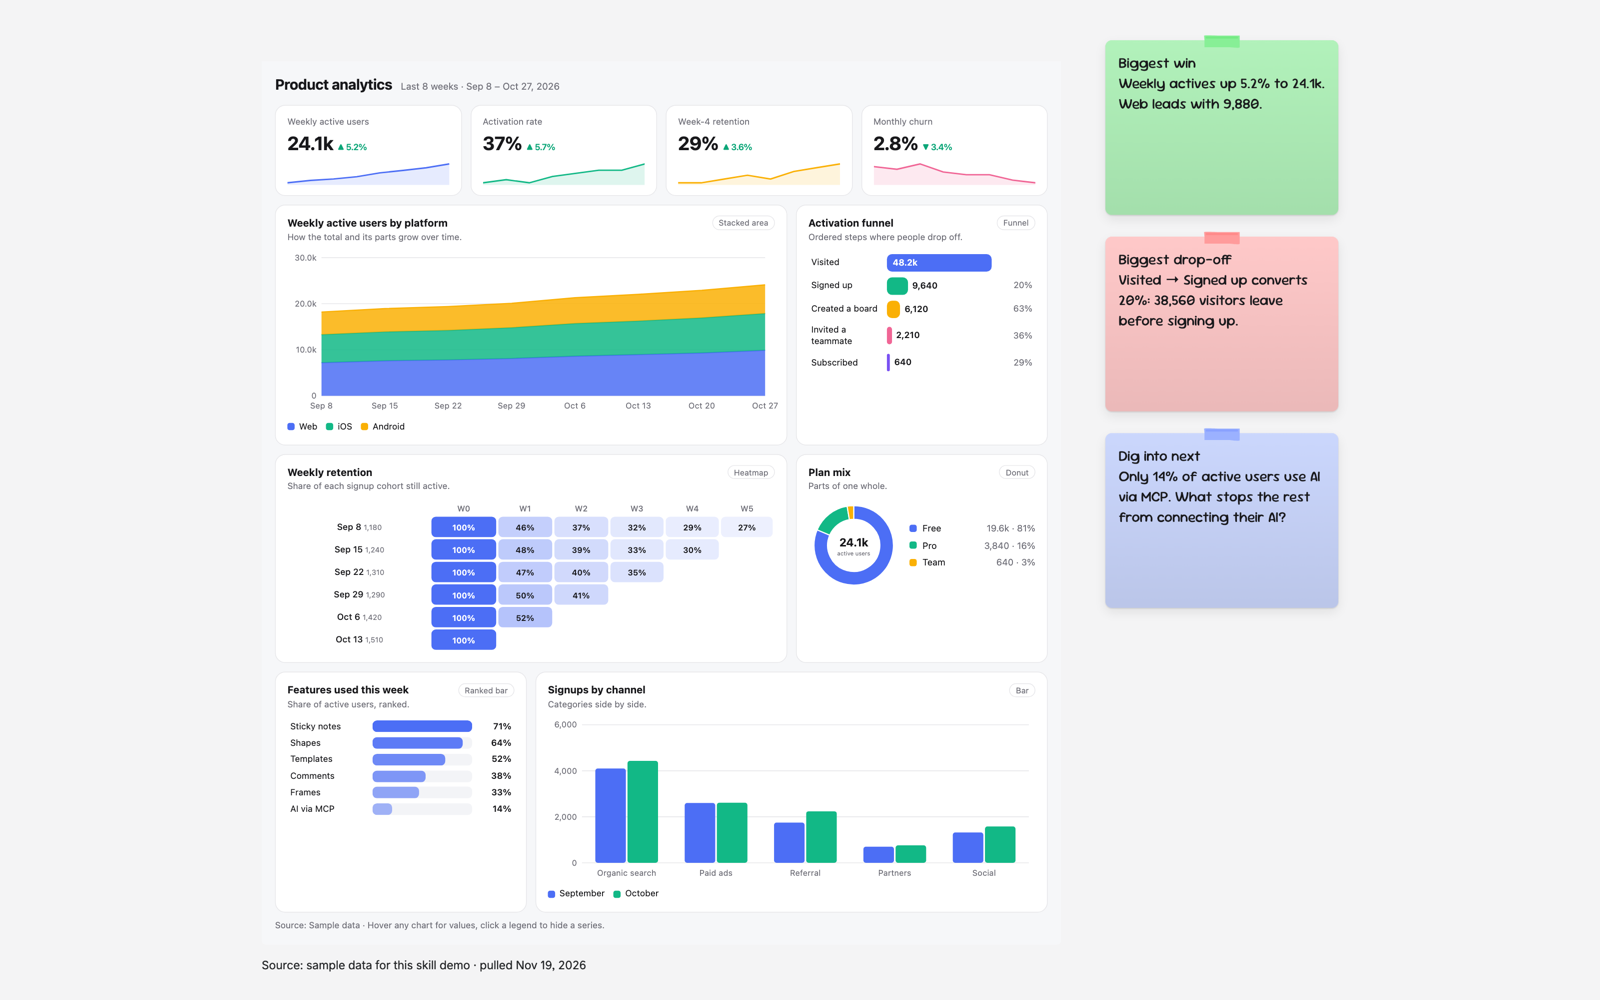
- Product analytics
- Sales pipeline
- Marketing performance
- Support operations
- Live preview
A real board an AI built with this skill.Open the real board
What you'll get
- Layout
- Grid
- Font
- Sans
Instructions
What your AI reads before it draws a board with this skill.
SKILL.md
- name
- dashboard-builder
- description
- Use when someone wants a dashboard from their data (product, sales, marketing or ops). Reads the data and picks the chart for each part: line or area for trends, bars to compare or rank, heatmaps, funnels, waterfalls, gauges for targets, treemaps and scatter.
Dashboard builder
An interactive dashboard the team can hover and click through on the board. Each panel's chart is chosen from the shape of its data.
Pick the chart from the data
Read the user's data first, then give each part of it the chart its shape calls for. Two dashboards with different data should not look the same.
| The data | Panel type |
|---|---|
| One headline number with its recent trend | a KPI (top row) |
| A measure over time: days, weeks, months | line |
| A total over time and the parts that make it up | area (stacked) |
| A few categories compared, or this period vs last | bar (stacked: true when each bar is parts of a total) |
| A ranking: reps, pages, topics, features | hbar |
| Parts of one whole, up to 6 slices | donut |
| Parts of one whole, 7 or more | treemap |
| Ordered steps where people drop off | funnel |
| A start value, the ups and downs, and the end value: pipeline, MRR, backlog, budget | waterfall |
| Progress toward a target or quota | gauge |
| Two categories with a value in each cell: cohort retention, day by hour, region by product | heatmap |
| Two measures per item, to show a relationship (a third as bubble size) | scatter |
| Exact values, many columns, or rows to look up | table |
- Time on the x axis is a line or area, not a bar, unless there are 6 periods or fewer and the point is comparing them.
- A donut only when the slices add up to a meaningful total; values that don't sum go in a bar or hbar.
- More than 7 series in a line or bar: keep the top 5 and fold the rest into "Other", or use a heatmap.
- Leave a chart type out when the data has nothing of that shape; never add a panel just to show a chart.
- One idea per panel; 4 to 8 panels; the most important panel goes first with a wider span.
Look
- theme.mode: "dark" for sales, finance or exec reviews that will be presented, "light" otherwise; theme.colors: up to 6 hex colours, the user's brand first when they give one, otherwise a palette that fits the subject.
- columns: 2 when there are 4 or fewer big panels, 3 by default, 4 when there are many small ones.
The dashboard
- Add the skill's example as an iframe item (its html, width 1100). Height: about 220 for the header and KPIs plus 340 per row of panels; a row is full when its spans add up to columns.
- Replace the DATA object at the top of its script: title, period, source, theme, columns, 0 to 5 kpis ({ label, format, values: recent values oldest first, lowerIsBetter for churn or cost }) and panels. Every panel has type, title, a short hint and an optional span (1 to columns). By type:
- line, area: x (labels), series [{ name, values }], format
- bar: categories, series [{ name, values }], stacked, format
- hbar: items [{ name, value }], format, sort (default true)
- donut, treemap: items [{ name, value }], format; donut also centerLabel
- funnel: steps [{ name, value }] in order
- waterfall: steps [{ name, value, total }], total: true on the first and last step (their value is the level), the rest are changes (negative for drops)
- gauge: items [{ name, value, target }], max (default 100), format, columns (gauges per row)
- heatmap: rows, cols, values (one array per row, missing cells left out), optional rowNotes, color, format
- scatter: points [{ name, x, y, size? }], xLabel, yLabel, sizeLabel, xFormat, yFormat
- table: columns [{ label, format }], rows (arrays, first cell is the row name) Formats: number, percent, percent1, currency.
- Never invent data silently: when a number is missing, ask, or set source to "Sample data".
Around it
- No frame and no board title around it: place the iframe in free space, its own header carries the title and period.
- To its right, three sticky notes, not rotated: the biggest win, the biggest drop (name the panel and the number), and one question to dig into next.
- Under the iframe, a small sans text with the data source and when it was pulled.
- When the user wants charts they can edit on the board instead, draw line and bar panels as chart items and a heatmap as a grid of rectangles with the value as each one's label.
Avoid
Pie or donut for trends, two y axes, 3D, more than 6 colours in one chart, and more than one dashboard per iframe.