Examples
Example whiteboards, drawn for real jobs
Every board here was drawn in Drawdy for the job its title names, with real or realistic data on it. Each one opens live in Drawdy, no account needed, so you see the board as it is today.
All 72 boards below, grouped by trade.
Software engineering
Architecture at four zoom levels, one request traced from DNS to a container, a TLS handshake byte by byte and an outage read from its post-mortem.
Use case: Drawdy for system design diagrams
For backend engineers
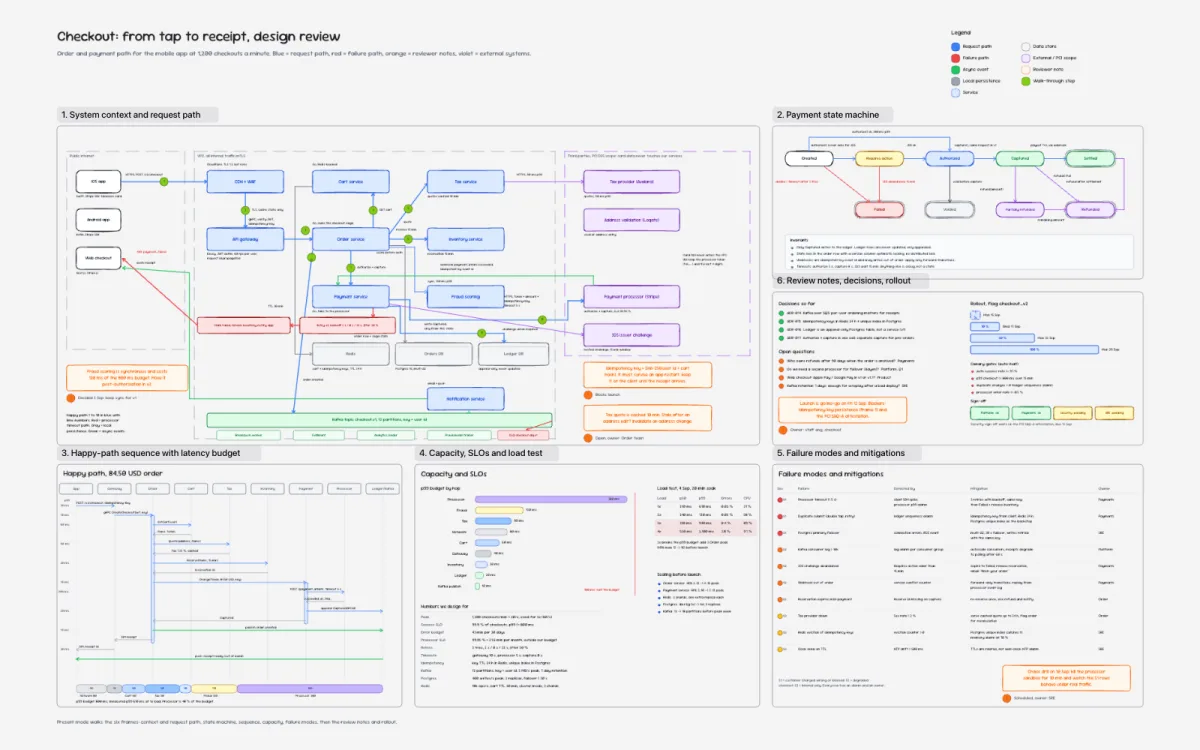
Checkout: from tap to receipt, design review
Follow one tap through a mobile checkout doing 1,200 orders a minute: the request path in blue, PCI scope boxed off, idempotency keys, Postgres and the Stripe tokenizer. The reviewer's notes and walk-through steps are written straight on the diagram.
Reviewed
For software architects
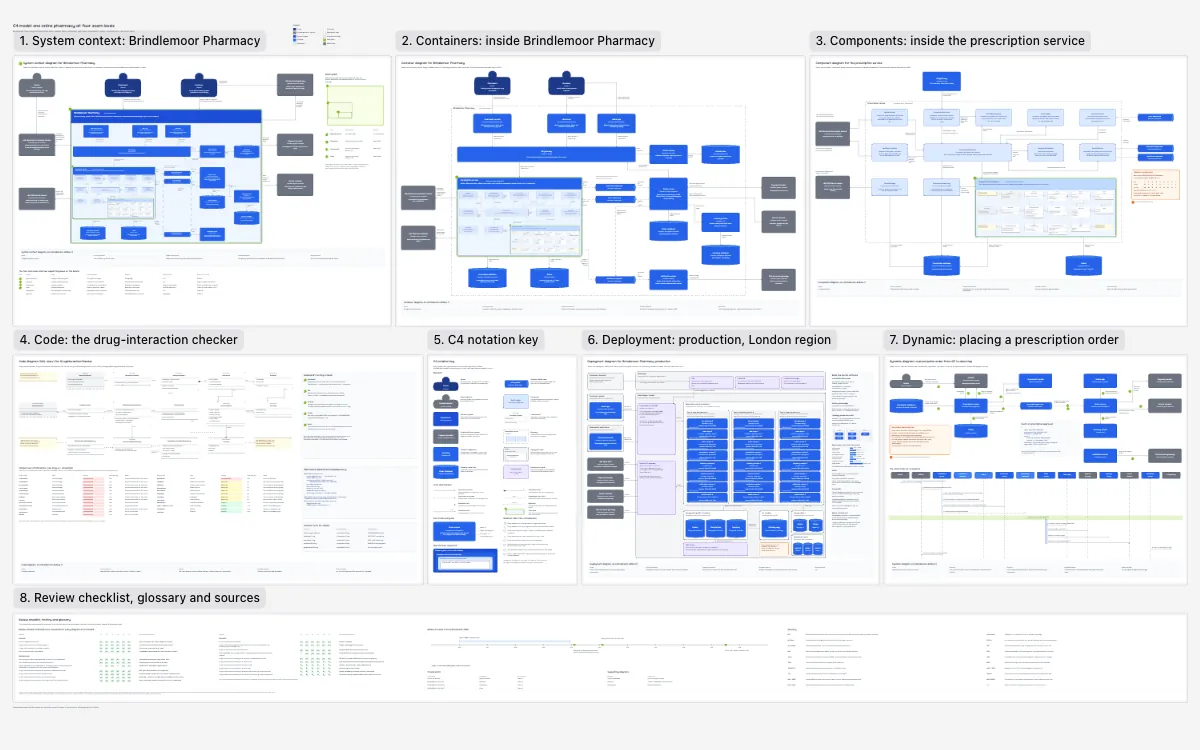
C4 model: one online pharmacy at four zoom levels
Brindlemoor, a fictional online pharmacy taking NHS prescriptions, drawn at all four C4 levels, each nested to scale inside the last: system context, containers, the prescription service's components and a UML class diagram of the drug-interaction checker. Deployment and dynamic views add a three-zone Kubernetes cluster in London and a 13-step order from GP to doorstep, held at a clarithromycin and simvastatin contraindication, plus a notation key and the c4model.com review checklist.
Reviewed
For platform engineers
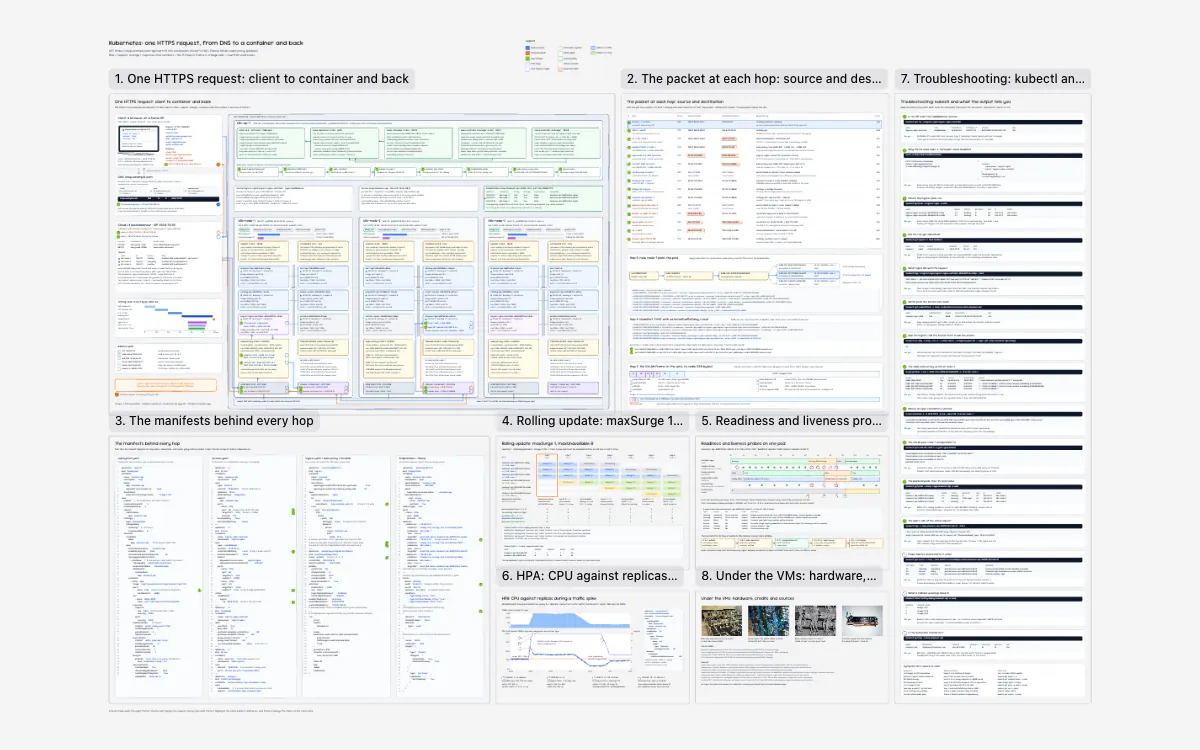
Kubernetes: one HTTPS request from DNS to a container
One GET to shop.example.com/api/cart/42 traced through a kubeadm cluster (Kubernetes v1.36.5, flannel VXLAN, kube-proxy iptables) in 15 hops and 60.6 ms, with the source and destination at every hop, the iptables chains that pick the pod and the VXLAN frame to scale. Further frames cover the manifests behind each hop, a maxSurge 1 rolling update, readiness and liveness probes, a simulated HPA traffic spike and kubectl troubleshooting cards.
Reviewed
For domain-driven design teams
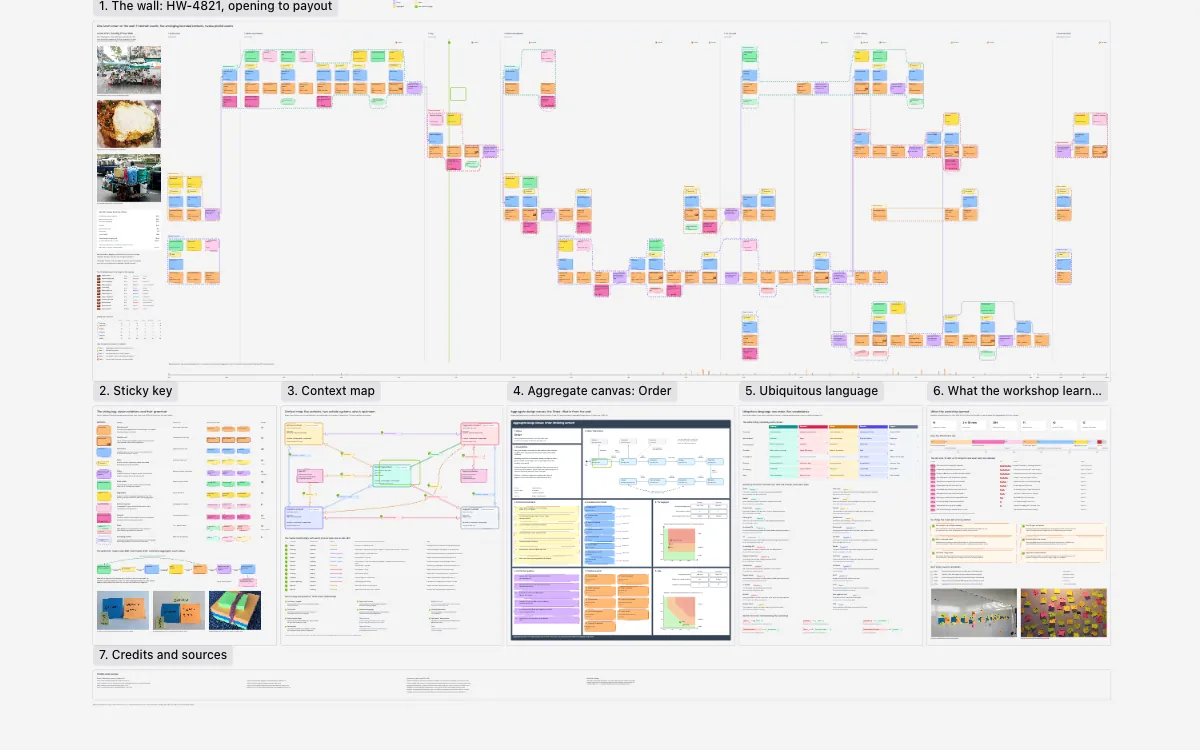
Event storming: one Bangkok lunch order
A worked example of Big Picture EventStorming for a Bangkok food delivery platform, following one lunch order, HW-4821, from the kitchen opening at 10:30 to the next morning's payout: 71 domain events, twelve pivotal events and five emerging bounded contexts. Follow-on frames give the sticky key, a context map of twelve relationships, an aggregate design canvas for the Order, the ubiquitous language and how the dot vote settled all twelve hotspots.
Reviewed
For system design candidates
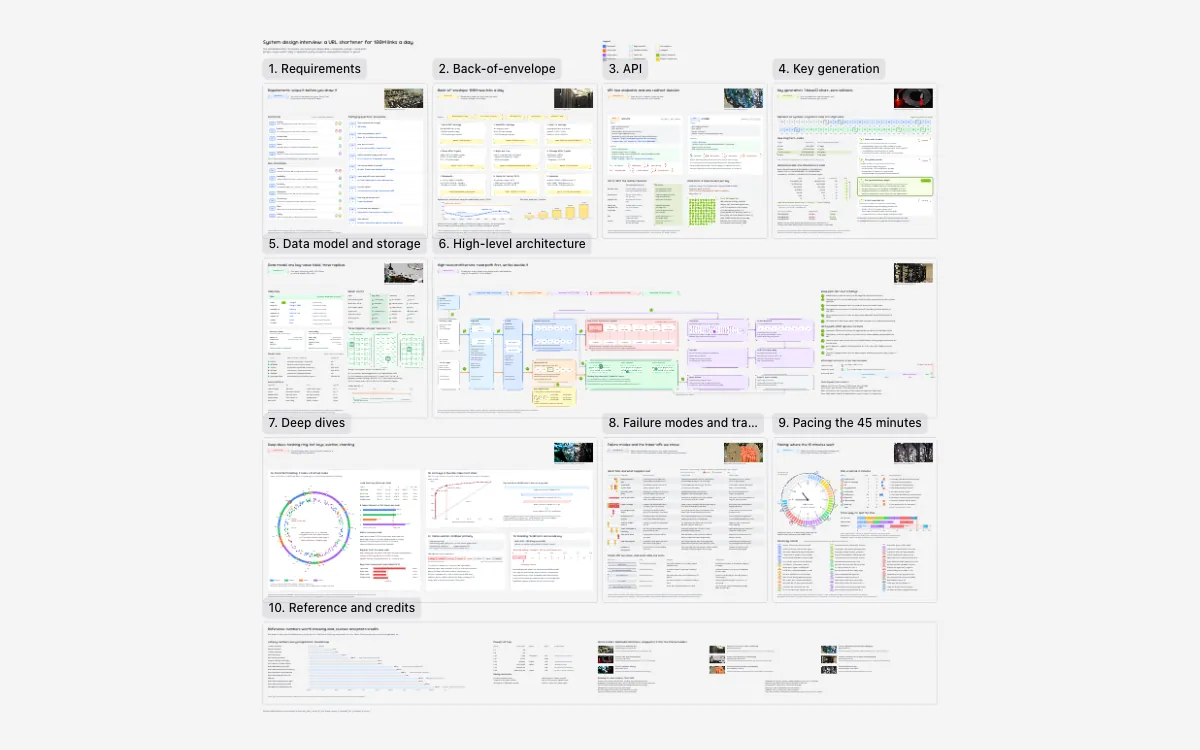
System design interview: a URL shortener
A 45-minute system design interview for a URL shortener taking 100M new links and 1B redirects a day, one frame per phase: requirements, back-of-envelope maths, the API and its 301 or 302 decision, base62 key generation, the data model and the high-level architecture. Deep dives on consistent hashing, hot keys, eviction and sharding follow, then failure modes with their trade-offs and a minute-by-minute pacing chart.
Reviewed
For geospatial engineers
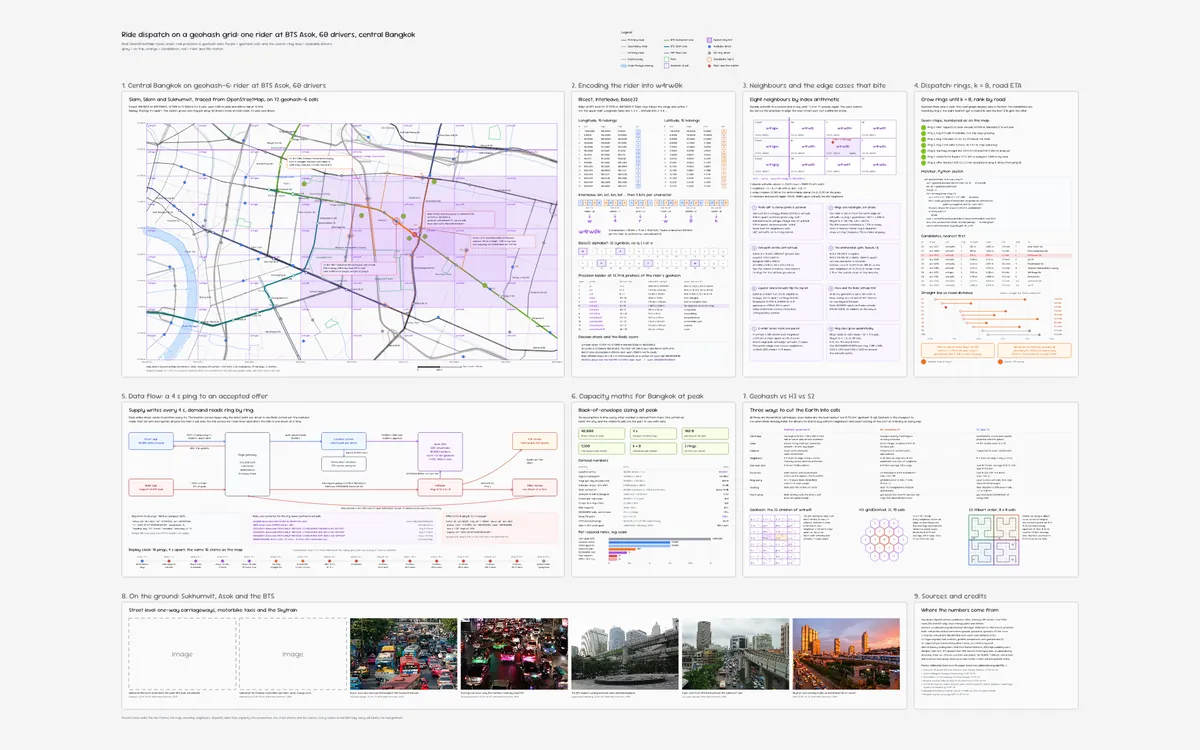
Ride dispatch on a geohash grid: one rider at BTS Asok
Real OpenStreetMap roads of central Bangkok under 72 geohash-6 cells, where a rider at BTS Asok is matched among 60 simulated drivers: the search grows ring by ring to k = 8, then road ETA picks the driver. Further frames encode the rider into w4rw0k, cover neighbour edge cases, a Redis GEO data flow sized for 40,000 drivers, peak capacity maths and geohash against H3 and S2.
Reviewed
For database engineers
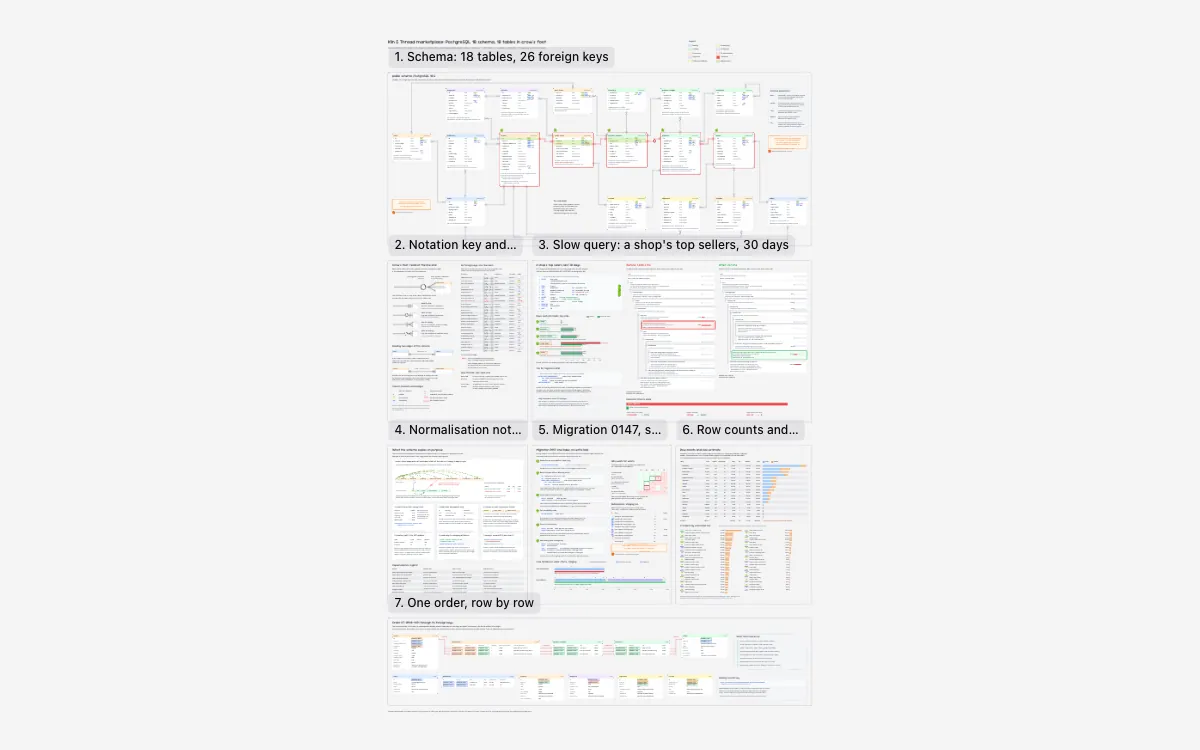
Kiln & Thread marketplace: 18 tables in crow's foot
The Kiln & Thread marketplace as a PostgreSQL 18 schema in crow's foot notation: 18 tables, 26 foreign keys and the two that lack an index. A shop's top-sellers query falls from 1,840 ms, a parallel seq scan of 12.04 M order lines, to 23.1 ms after migration 0147 indexes order_items.variant_id without a write lock, and further frames add normalisation notes, size estimates and one order traced row by row.
Reviewed
For security engineers
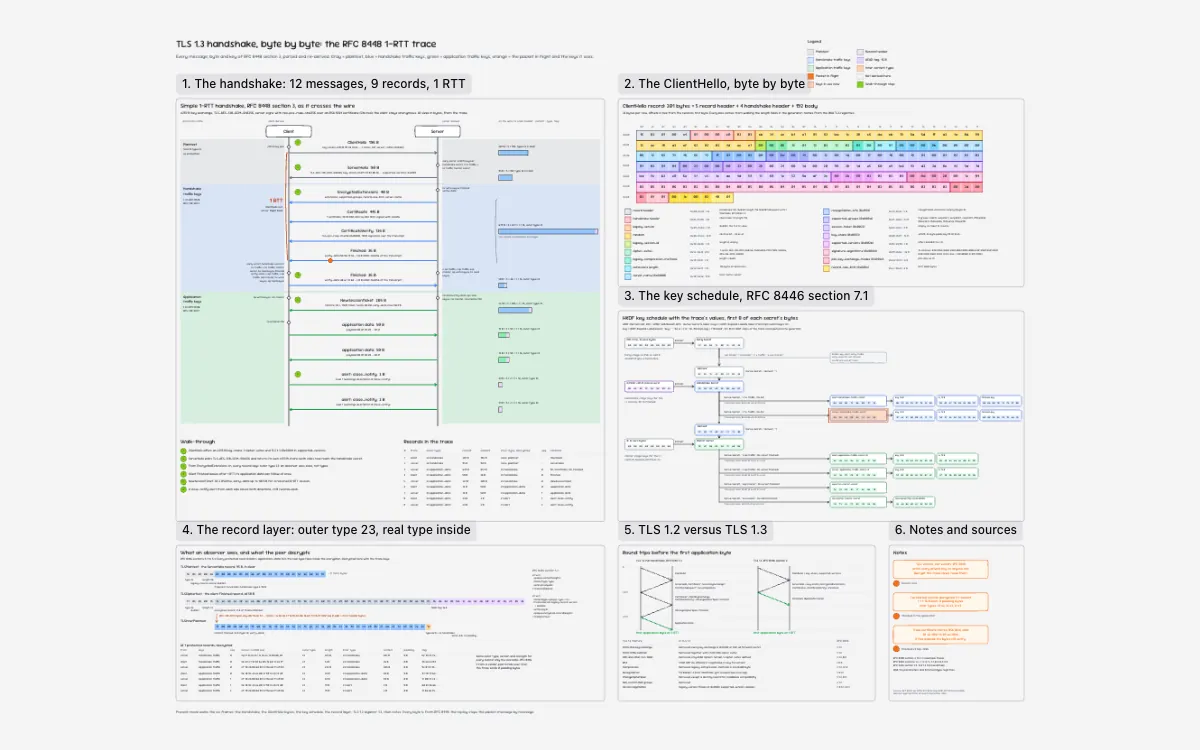
TLS 1.3 handshake, byte by byte: RFC 8448 1-RTT trace
The simple 1-RTT handshake from RFC 8448 section 3, parsed and re-derived: 12 messages in 9 records over x25519 and TLS_AES_128_GCM_SHA256, the 201-byte ClientHello field by field and the RFC 8446 key schedule with the trace's values. The record layer frame decrypts all 7 protected records to show the real content type under outer type 23, and TLS 1.2 is set against 1.3 by round trips and removed features.
Reviewed
For site reliability engineers
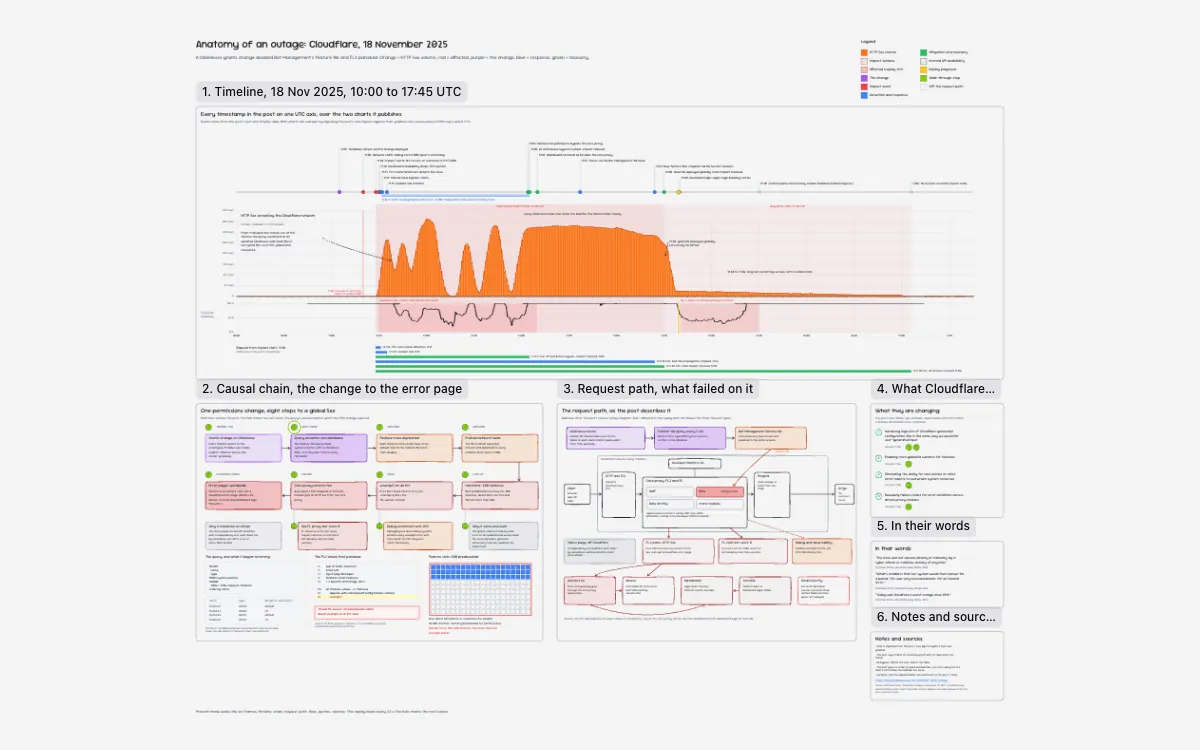
Anatomy of an outage: Cloudflare, 18 November 2025
Cloudflare's 18 November 2025 outage, redrawn from Matthew Prince's post on the Cloudflare blog: every timestamp on one UTC axis over the post's charts of HTTP 5xx volume and internal API availability, with main impact from 11:28 to 14:30 and a long tail to 17:06. An eight-step causal chain runs from the 11:05 ClickHouse grants change to the 200-feature limit and FL2's unwrap() panic, beside the request path and Cloudflare's four follow-ups.
Reviewed
Product and design
Wireframes with every state drawn, a dashboard at three breakpoints, and research boards that end in a decision.
Use case: Drawdy for wireframes and user flows · Drawdy for brainstorming
For product designers
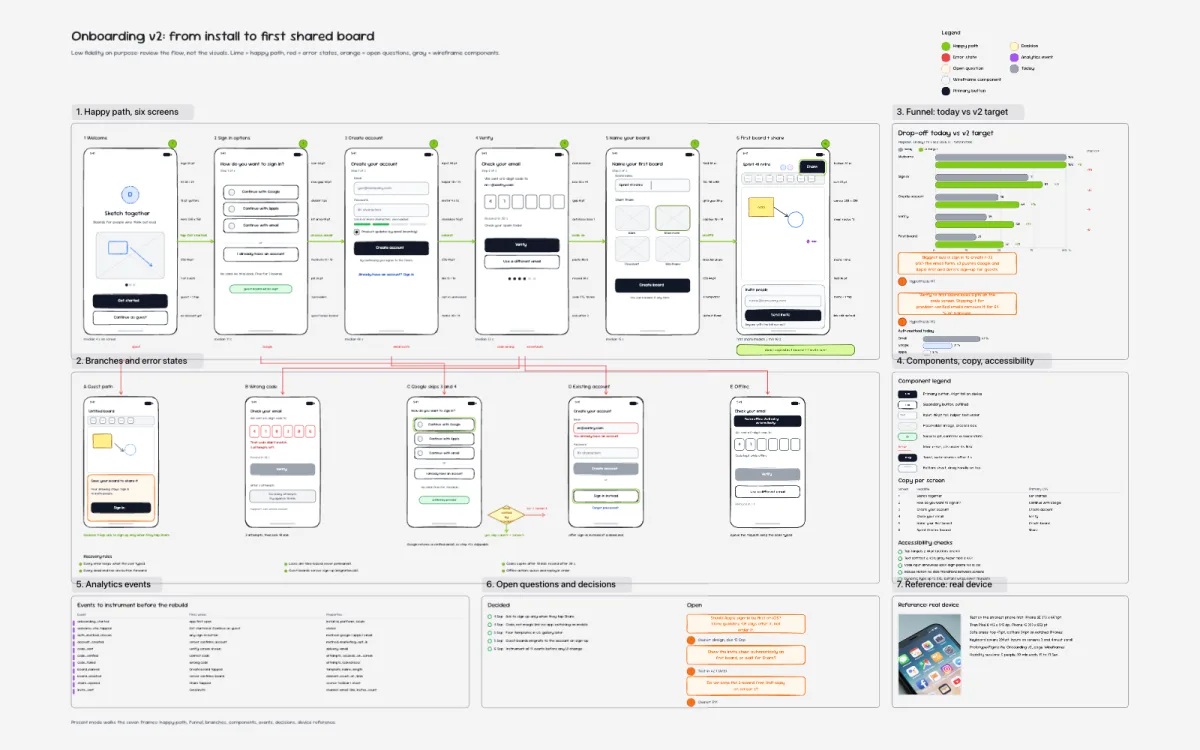
Onboarding v2: from install to first shared board
Sign-in to first shared board in low-fidelity screens: the happy path in lime, error states in red, analytics events marked where they fire. Rough on purpose, so the review argues about the flow instead of the pixels.
Reviewed
For mobile UX designers
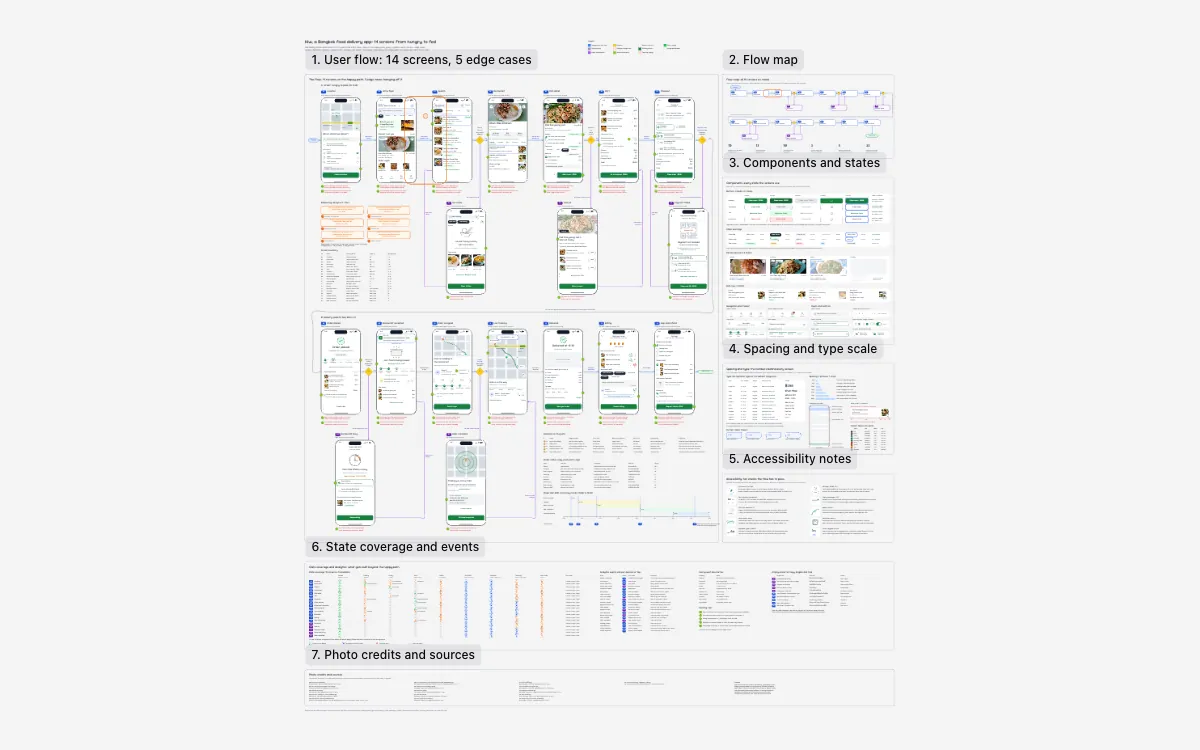
Hiw, a Bangkok food delivery app: 14 screens
Mid-fidelity iPhone wireframes at 390 x 844 pt for Hiw, an invented Bangkok food delivery app: 14 screens from setting a location to a refund, 5 edge cases from sold out to an expired PromptPay QR, and 33 red-pen notes. Order HW-4821 is traced minute by minute to its 34-minute delivery, beside a component kit in every state, iOS Dynamic Type sizes, ten accessibility checks, a 171-cell state coverage grid and 21 analytics events.
Reviewed
For fintech designers
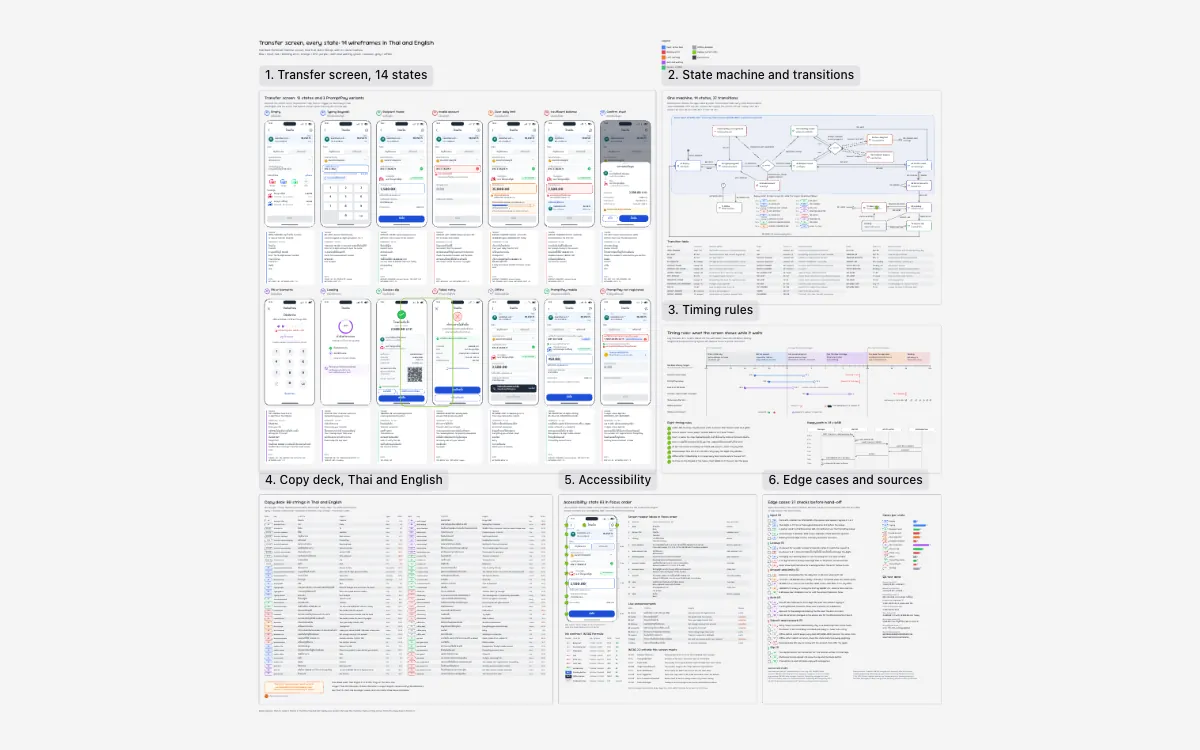
Transfer screen: 14 wireframes in Thai and English
Every state of a fictional Mali Bank transfer screen in 14 mid-fi wireframes at 360 x 760 dp, from empty form through limit errors to PIN, success slip, offline and two PromptPay variants, each with trigger, exits and Thai and English microcopy. Behind them: a state machine of 37 transitions, wait-time rules on Nielsen's limits, an 80-string copy deck, screen-reader focus order and 27 edge cases, among them the Bank of Thailand face-scan rule.
Reviewed
For growth marketers
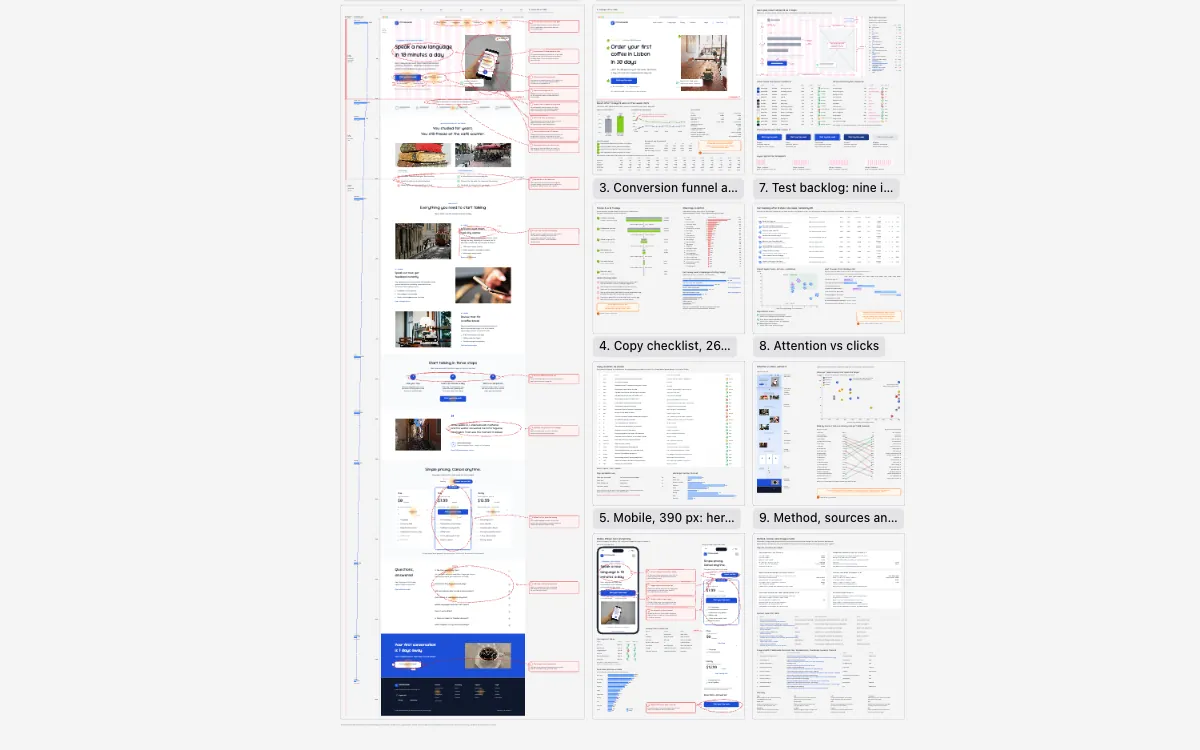
Landing page wireframe, annotated for conversion
The full 1440 px desktop page of Phrasewalk, a fictional language app, marked up in red pen with scroll depth, click heat and 15 notes on the fold, CTA contrast, social proof and pricing. In a 14-day hero A/B test on 49,630 sessions, variant B lifts free-week starts 18.9% (p = 0.0003); the funnel, a 26-check copy audit, the 390 px mobile view, a hero spec and nine ICE-ranked tests follow.
Reviewed
For product designers
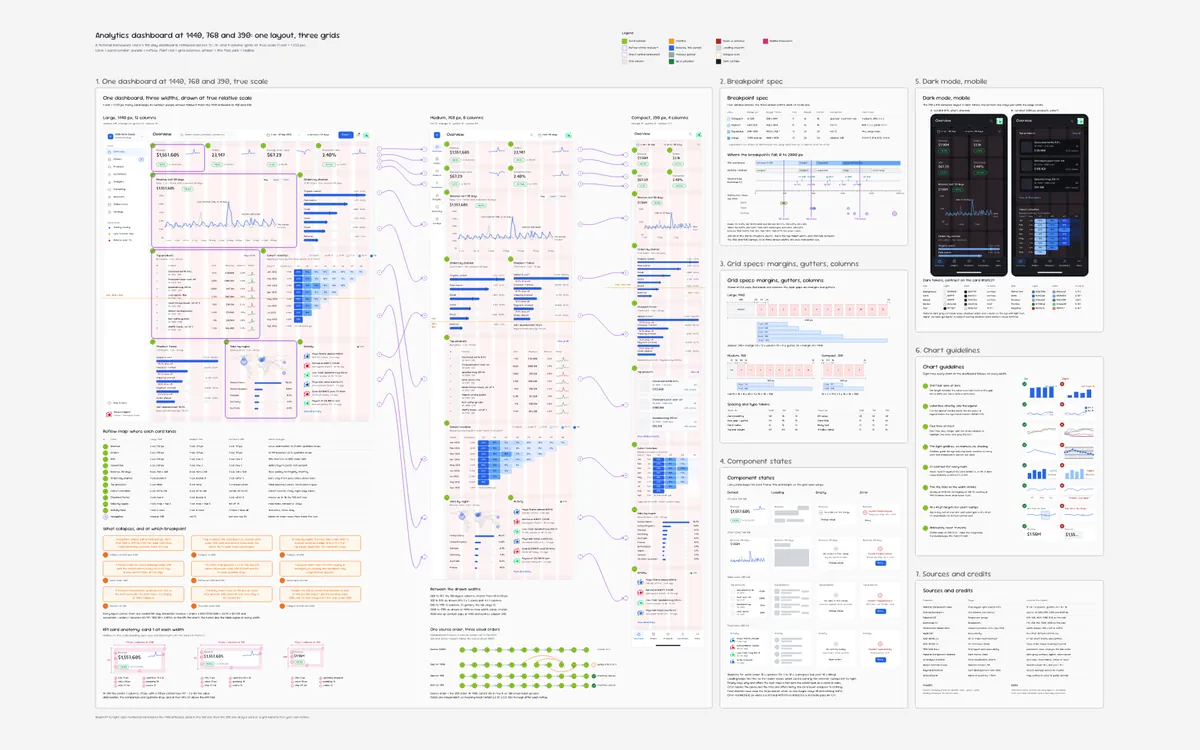
Analytics dashboard at 1440, 768 and 390
The 90-day dashboard of Saltmarsh Goods, a fictional homeware store, drawn to true scale at 1440, 768 and 390 px on 12-, 8- and 4-column grids, with arrows following its 11 numbered cards through each reflow. Around it sit the breakpoint spec against Material, Tailwind and Bootstrap, grid and type tokens, a dark mobile theme with contrast ratios, eight chart rules and loading, empty and error states for four card types.
Reviewed
For UX researchers
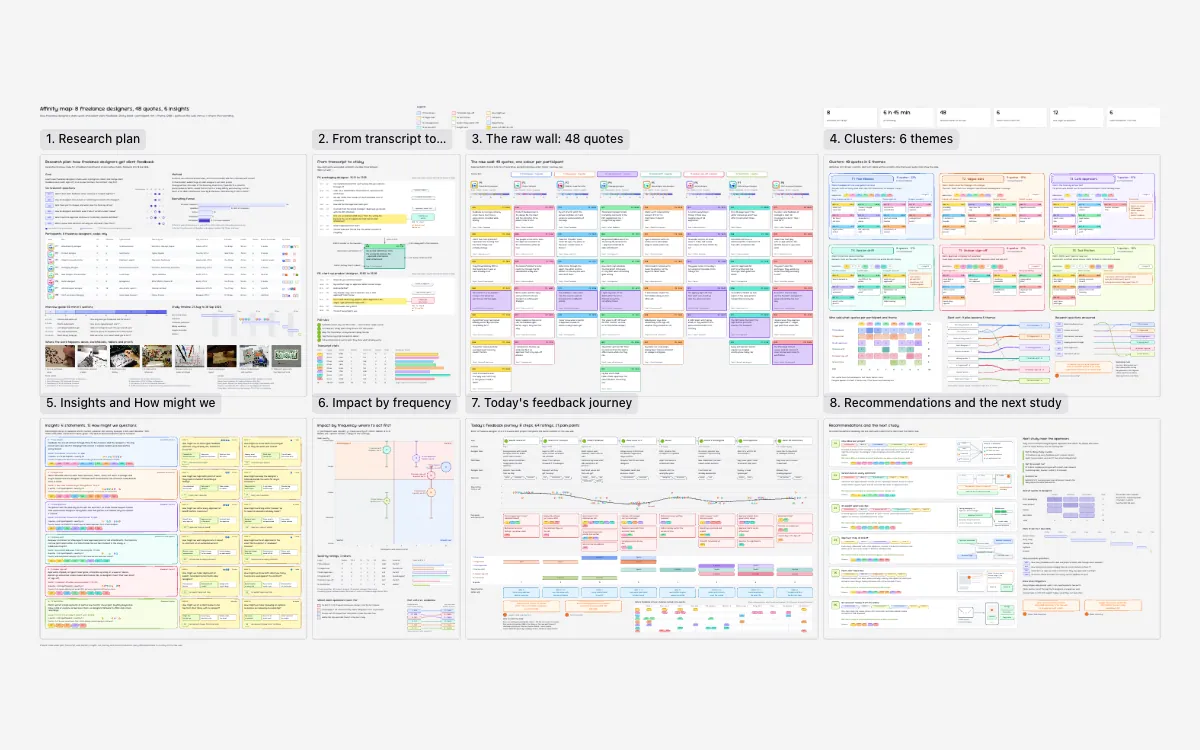
Affinity map: 8 freelance designers, 48 quotes
An illustrative study of how 8 freelance designers collect client feedback: 6 h 45 min of recordings pulled into 48 verbatim quotes on a raw wall, silent-sorted by 3 sorters into 6 themes from Five inboxes to Tool friction. Each theme becomes an insight with 2 How might we questions, scored on frequency against Nielsen severity, traced through an 8-step journey with 21 pain points and turned into 6 recommendations with pilot metrics.
Reviewed
For CX and marketing teams
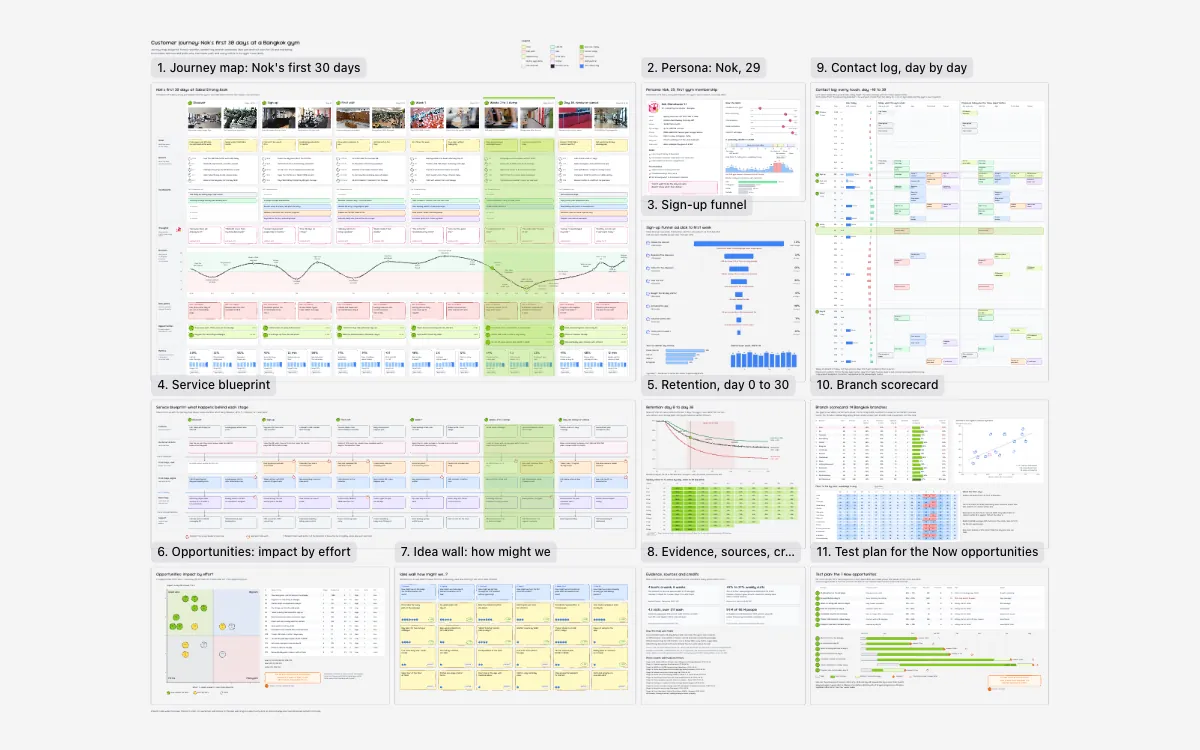
Customer journey: Nok's first 30 days at a Bangkok gym
Nok, 29, takes a 990 THB starter at Sabai Strong, a fictional Bangkok gym chain, and her first 30 days are mapped across six stages with touchpoints, diary quotes, an emotion curve, pain points and a service blueprint. The numbers follow: a funnel from 3,600 ad clicks to 121 starters with three visits in week 1, retention split by induction within 48 hours, a 14-branch scorecard and a test plan for 7 opportunities.
Reviewed
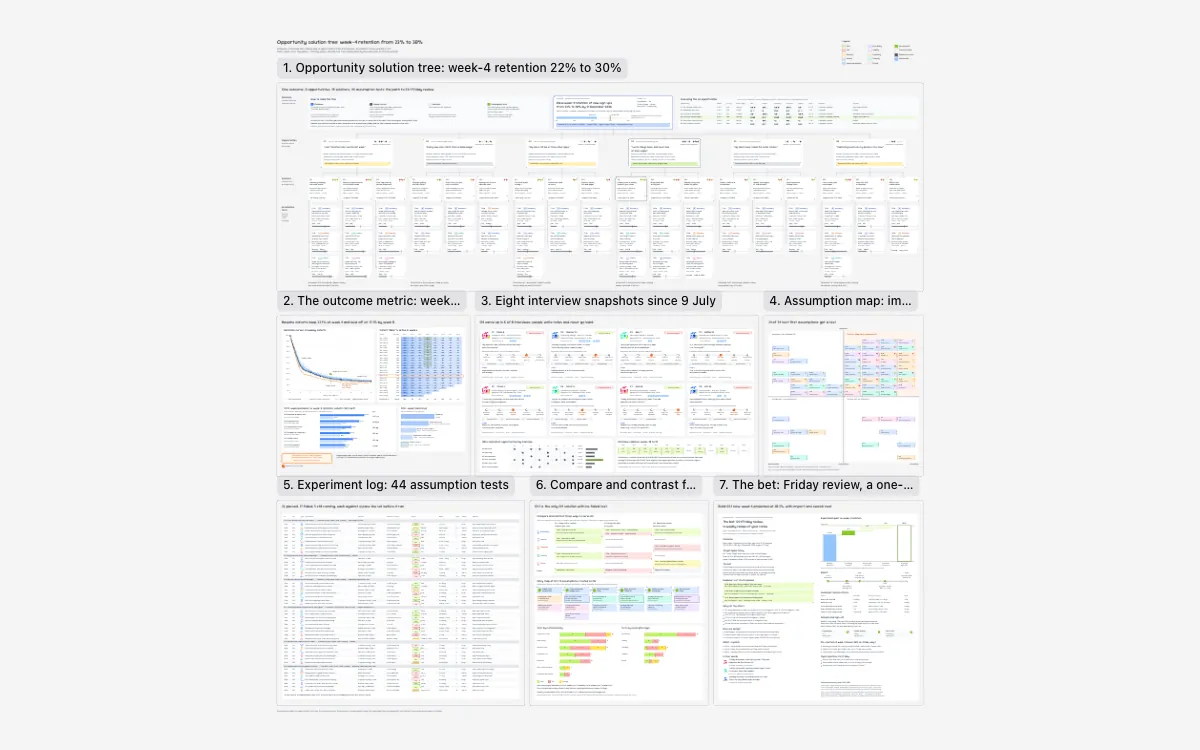
For product managers
Opportunity solution tree: week-4 retention 22% to 30%
Notewren, a fictional note-taking app, wants week-4 retention up from 22.1% to 30% by 31 December 2026, and its opportunity solution tree, after Teresa Torres, holds 6 opportunities from 8 interviews, 18 solutions and 44 assumption tests. Weekly cohort curves, interview snapshots, an assumption map and the experiment log lead to the chosen bet, a Friday review recap, written up with rollout dates, guardrails and kill criteria.
Reviewed
Team work and planning
A brainstorm, a retro, a root-cause fishbone, a roadmap, an org chart and a café plan, each with owners and numbers on it.
Use case: Drawdy for brainstorming
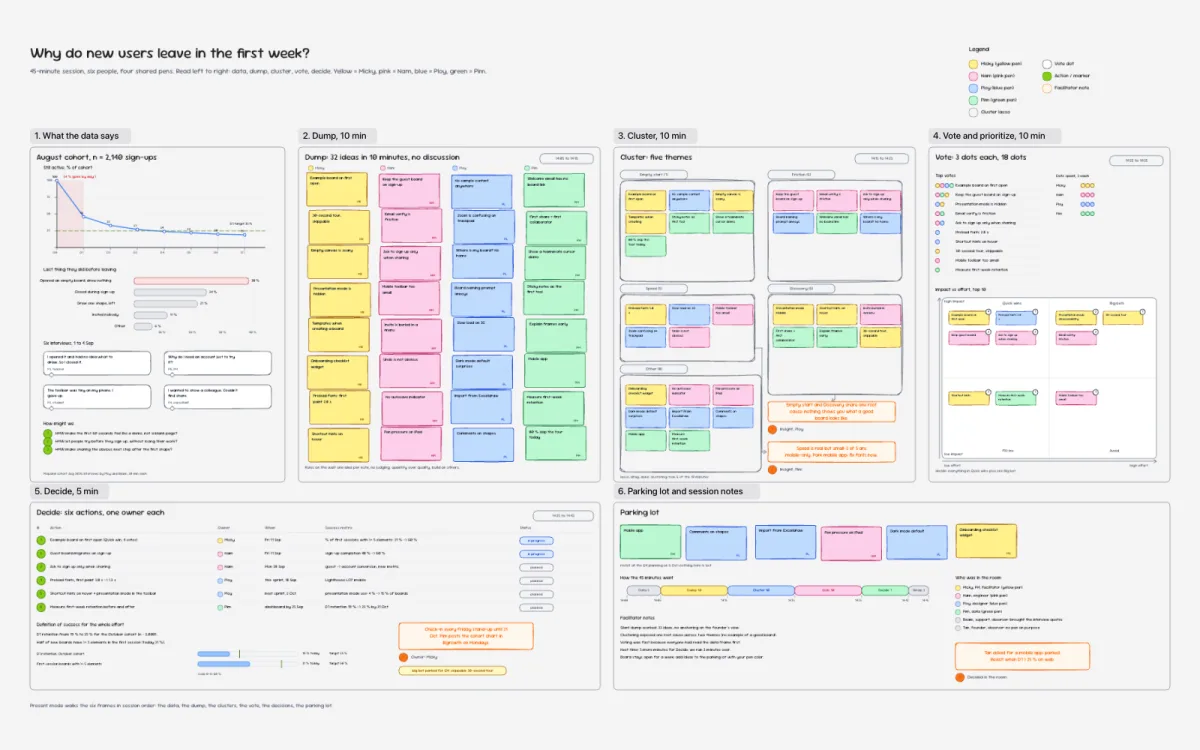
For product teams
Why do new users leave in the first week?
Six people, four pens and 45 minutes that ended in decisions: cohort retention on the left, the idea dump in the middle, lassoed clusters and how-might-we questions on the right. The facilitator's notes are still on the board.
Reviewed
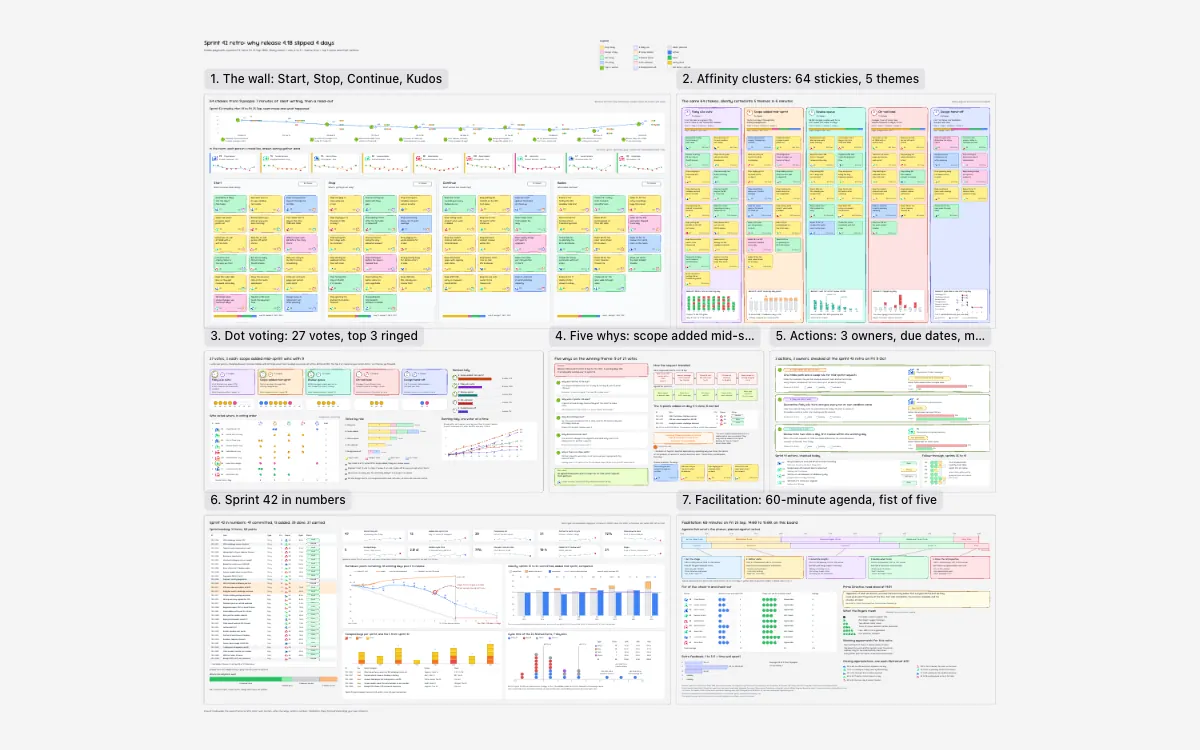
For Scrum Masters
Sprint 42 retro: why release 4.18 slipped 4 days
A worked retro for a 9-person mobile payments squad whose release 4.18 slipped 4 days: a mood timeline, 64 stickies under Start, Stop, Continue and Kudos, 5 affinity themes and 27 dot votes won by scope added mid-sprint. Five whys trace the 13 points added on day 4 to a missing intake path and swap rule, then 3 actions get owners, due dates and metrics, beside the burndown, velocity and a 60-minute facilitation plan.
Reviewed
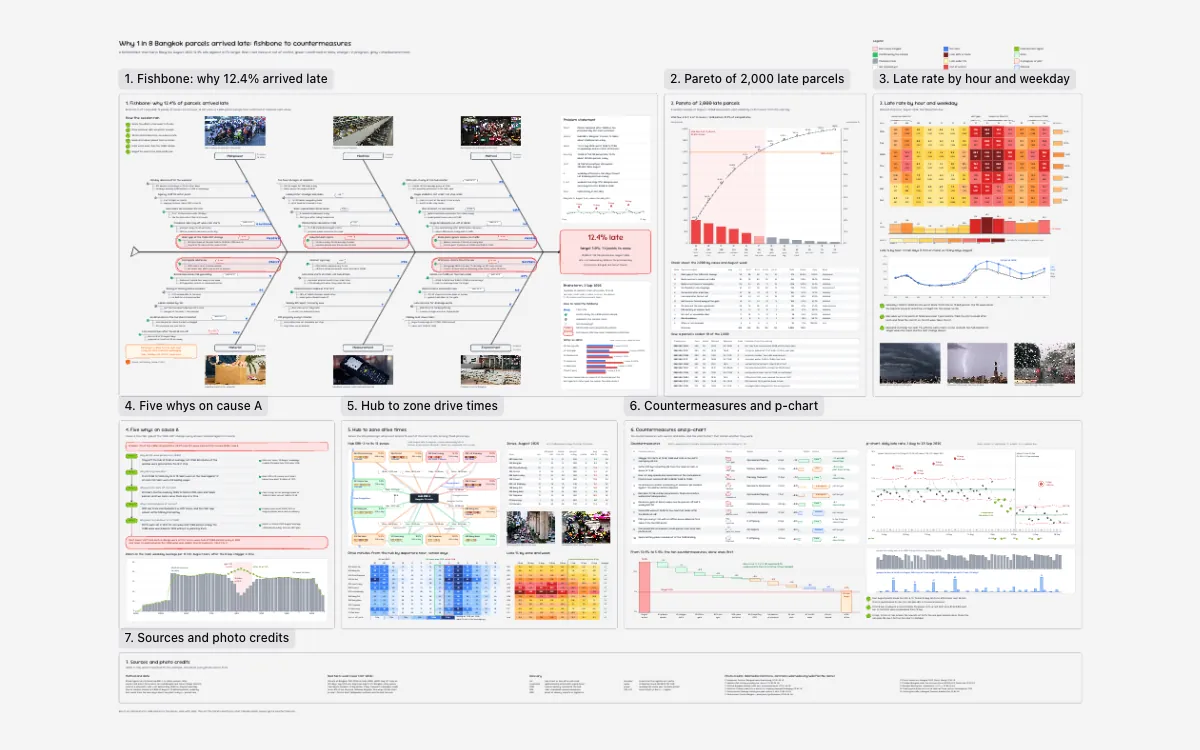
For logistics managers
Why 1 in 8 Bangkok parcels arrived late
A fictional last-mile hub in Bang Na, Bangkok, delivered 12.4% of 120,710 August parcels late against a 5% target: a 6M fishbone holds 31 causes and 72 dot votes, and a Pareto of 2,000 sampled lates puts 81.9% on 6 causes. A late-rate heatmap by hour and weekday, five whys on the 14:00 shift gap, drive times to 12 zones and ten countermeasures follow, with a p-chart tracking the drop to 8.5% from 15 September.
Reviewed
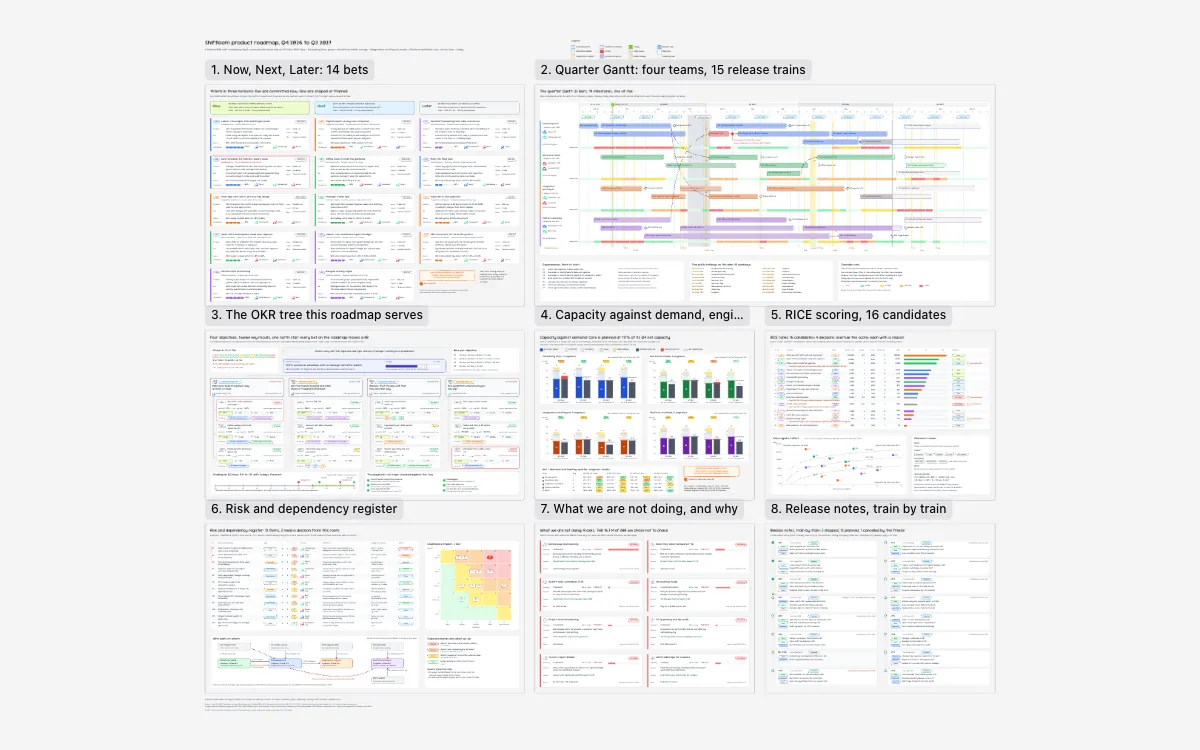
For product leaders
Shiftloom product roadmap, Q4 2026 to Q3 2027
Shiftloom, a fictional B2B shift-scheduling SaaS, lays out 14 bets as Now, Next and Later and a quarter Gantt of four teams on 15 release trains, with Thai holidays, the year-end freeze and one milestone at risk. An OKR tree, engineer-week capacity with Core at 117% in Q4, RICE scores for 16 candidates, a 12-item risk register, 8 refused asks worth THB 16.7 M of ARR and per-train release notes complete the leadership review.
Reviewed
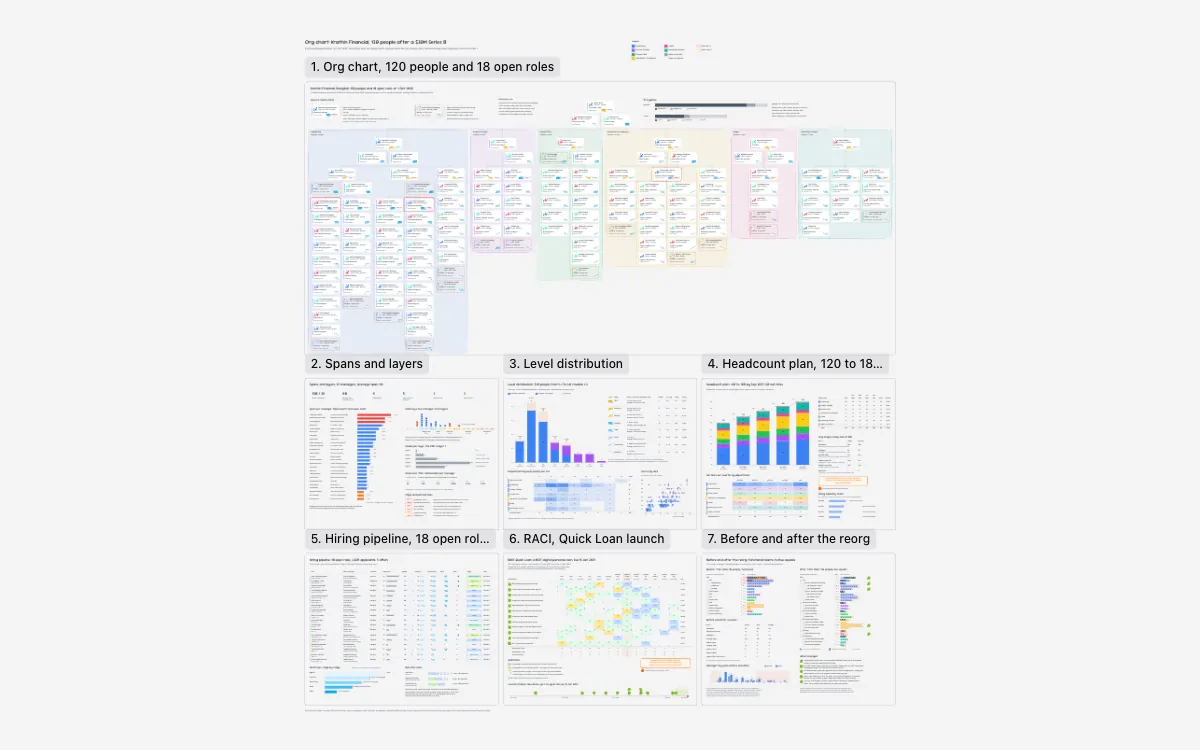
For HR and people leaders
Org chart: 120 people after a $30M Series B
Krathin Financial, a fictional Bangkok fintech after a $30M Series B, on 1 October 2026: 120 people and 18 dashed open roles across six departments, engineering in five squads, each card with level, tenure and span. Side frames cover spans and layers, levels L1 to L8, a headcount plan to 180 by September 2027, a pipeline of 3,639 applicants, a RACI for the Quick Loan launch and the reorg from functional teams to squads.
Reviewed
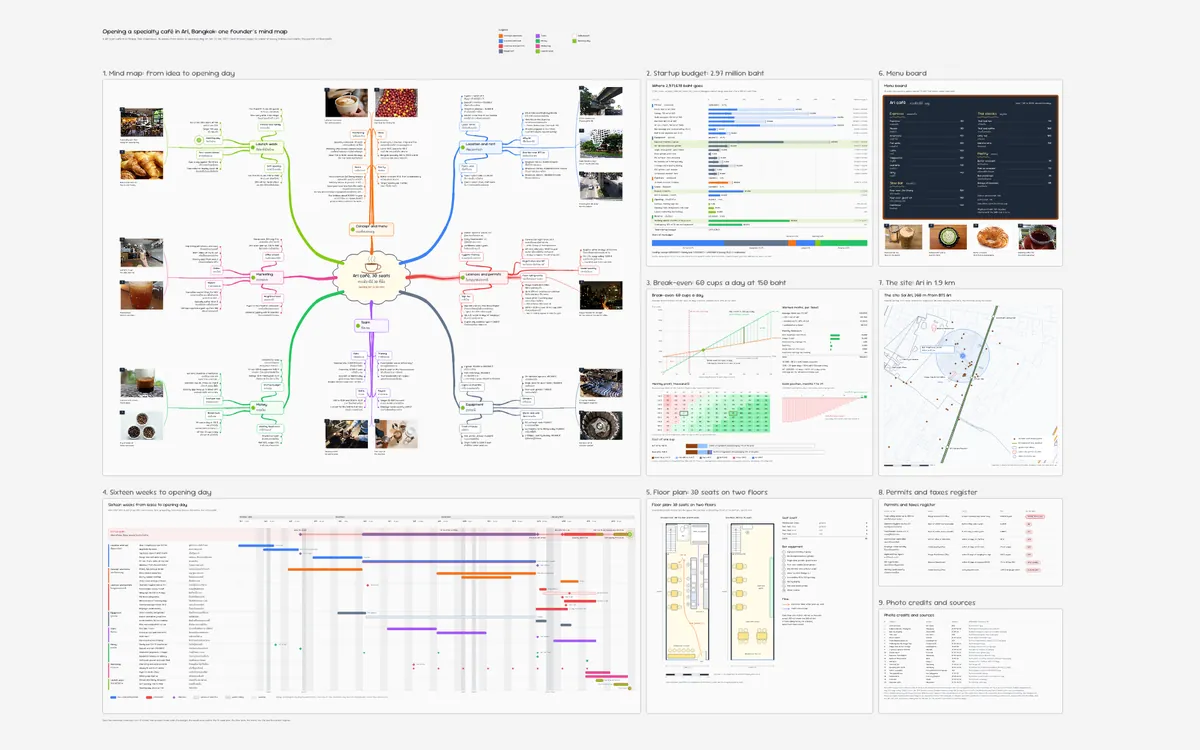
For café founders
Opening a specialty café in Ari, Bangkok
One founder's Thai and English mind map for opening a 30-seat specialty café in Ari, Bangkok: eight branches from concept to launch week, 16 weeks from lease to opening day on 23 January 2027. The frames price and schedule it: a 2,971,678 baht budget in 24 line items, break-even at 60 cups a day, a Gantt with the permit critical path, a floor plan, the menu board and 48 nearby cafés mapped.
Reviewed
Teaching
A lesson drawn to be walked through, the twelve English tenses on one timeline, both Japanese kana, and a kanji course of 2,300 characters that writes itself.
Use case: Drawdy for teaching and tutoring
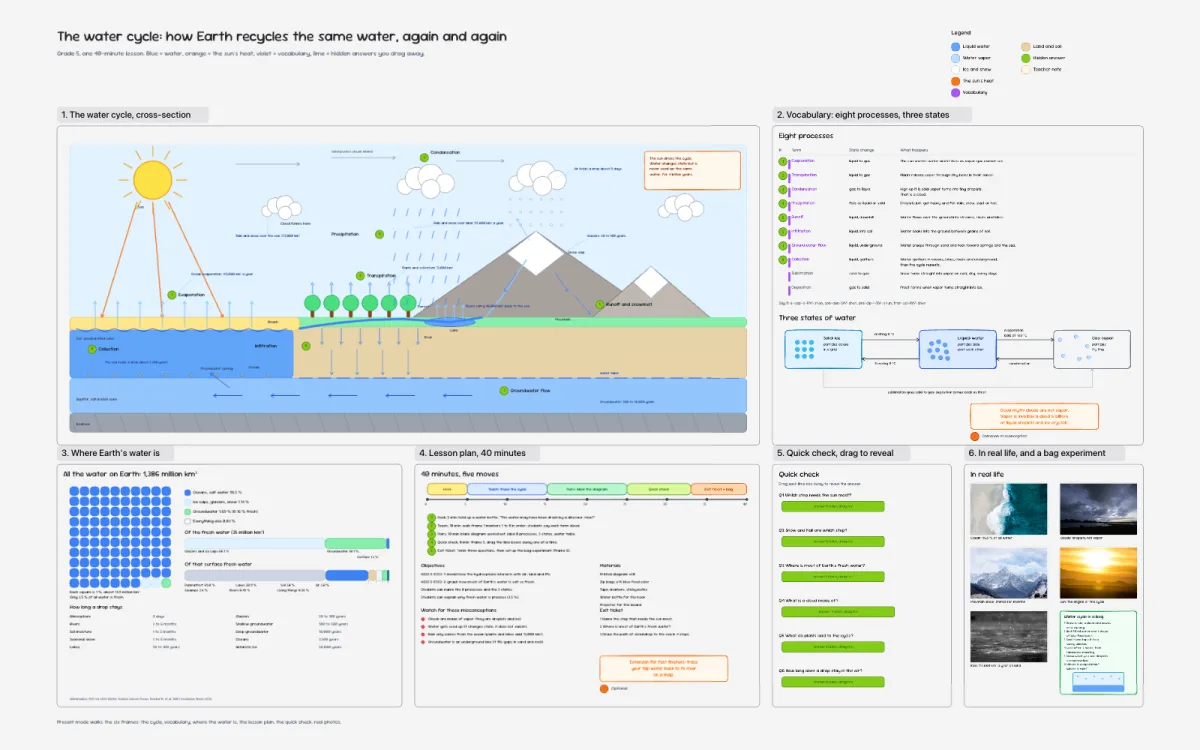
For grade 5 teachers
The water cycle
One 40-minute lesson drawn as a loop: evaporation, transpiration, precipitation, runoff and groundwater, the sun's heat in orange and real volumes in cubic kilometres a year. The answers stay hidden until the class has guessed.
Reviewed
For English teachers in Thailand
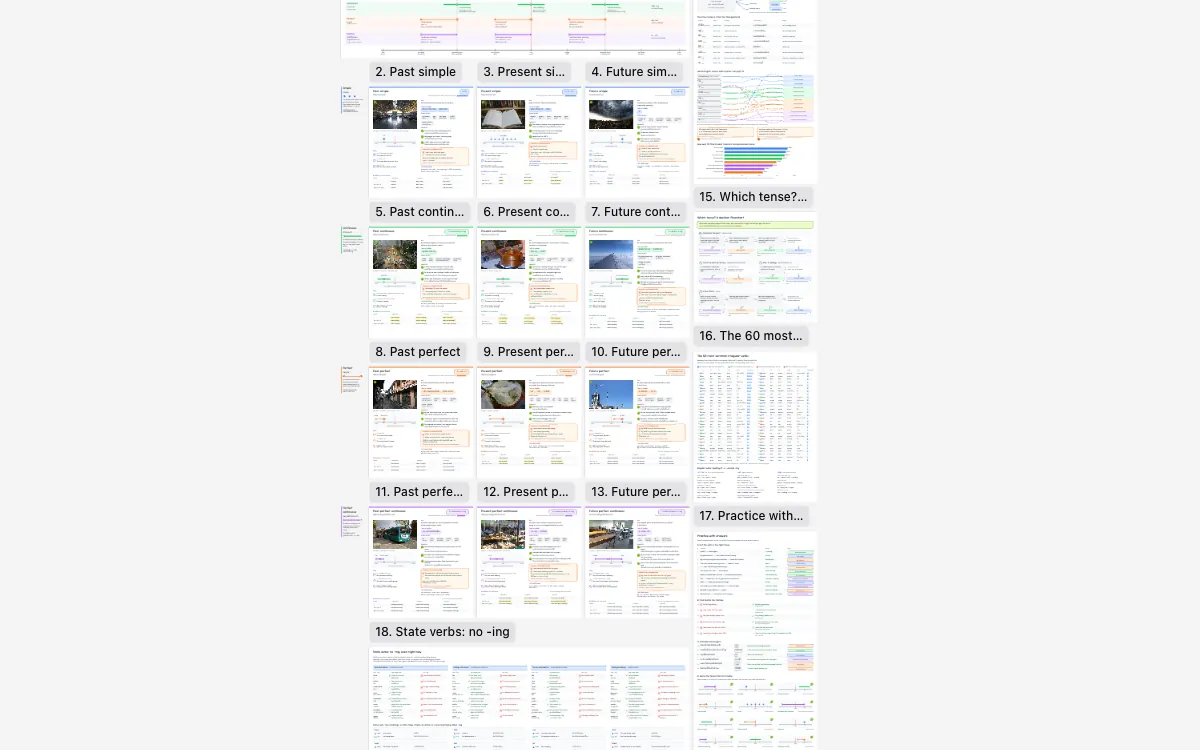
English tenses: all 12 on one timeline
All 12 English tenses of the verb work on one master timeline, then a card per tense with its form, use, Thai cue words, signal words, examples with Thai translations and the common Thai-learner mistake, plus recognition rates from 149 Thai student teachers. Further frames show how Thai marks time with แล้ว, กำลัง and จะ, a which-tense flowchart, the 60 most common irregular verbs, state verbs and 36 practice items with answers.
Reviewed
For Japanese language teachers
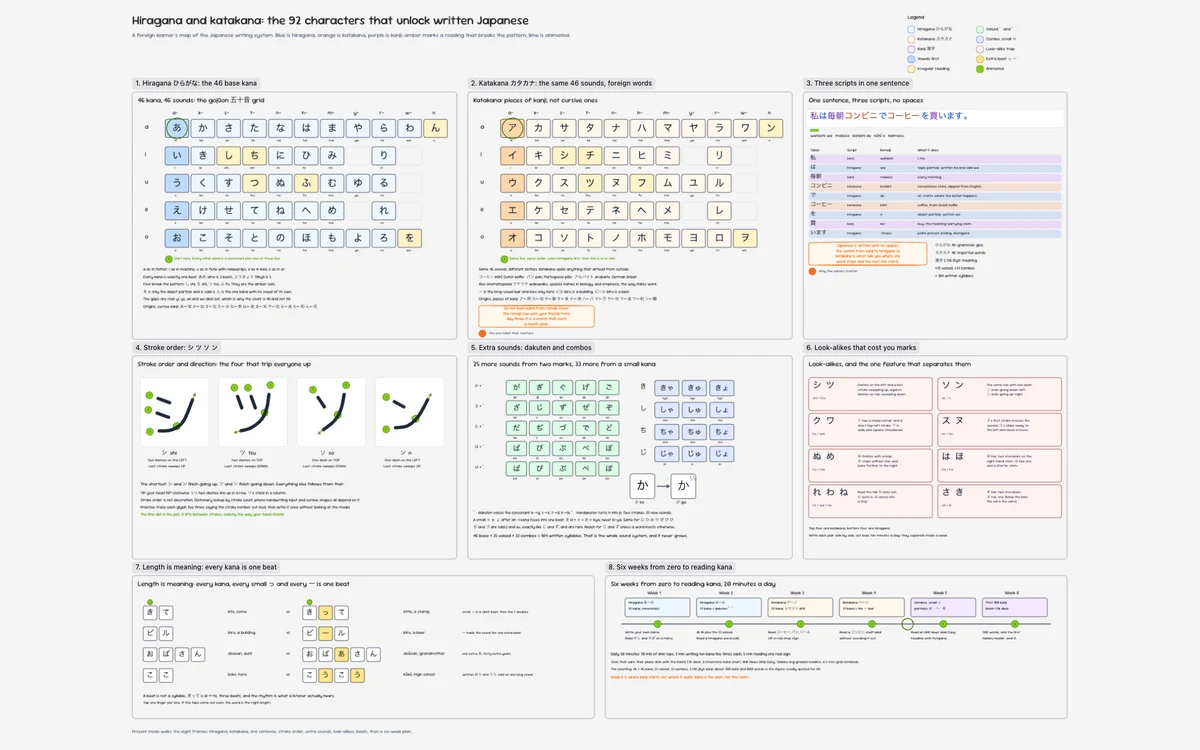
Hiragana and katakana: all 92 kana in one map
Both gojūon grids side by side: 46 hiragana and 46 katakana with romaji, the four irregular readings in amber and every kana's man'yōgana origin. Then what a wall chart leaves out: stroke order animated for シ ツ ソ ン, the 25 voiced kana and 33 yōon combos, one sentence colour-coded by script, and the mora that make きて and きって different words.
Reviewed
For Japanese language teachers
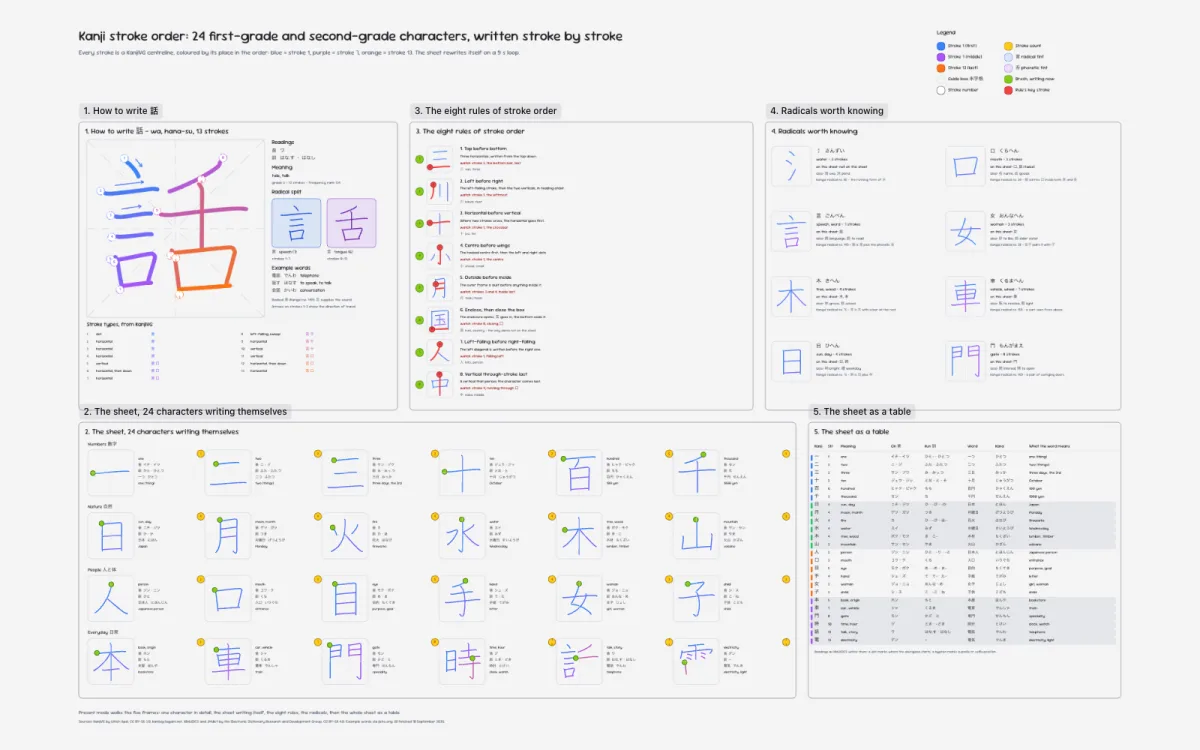
Kanji stroke order: 24 characters that write themselves
Twenty-four first- and second-grade kanji on a sheet that wipes and rewrites itself stroke by stroke, every stroke a KanjiVG centreline coloured by its place in the order. Beside it, 話 drawn large with all 13 strokes numbered and split into its 言 and 舌 halves, the eight stroke-order rules each with the character that proves it, eight radicals, and a table of readings and example words.
Reviewed
For Japanese language learners
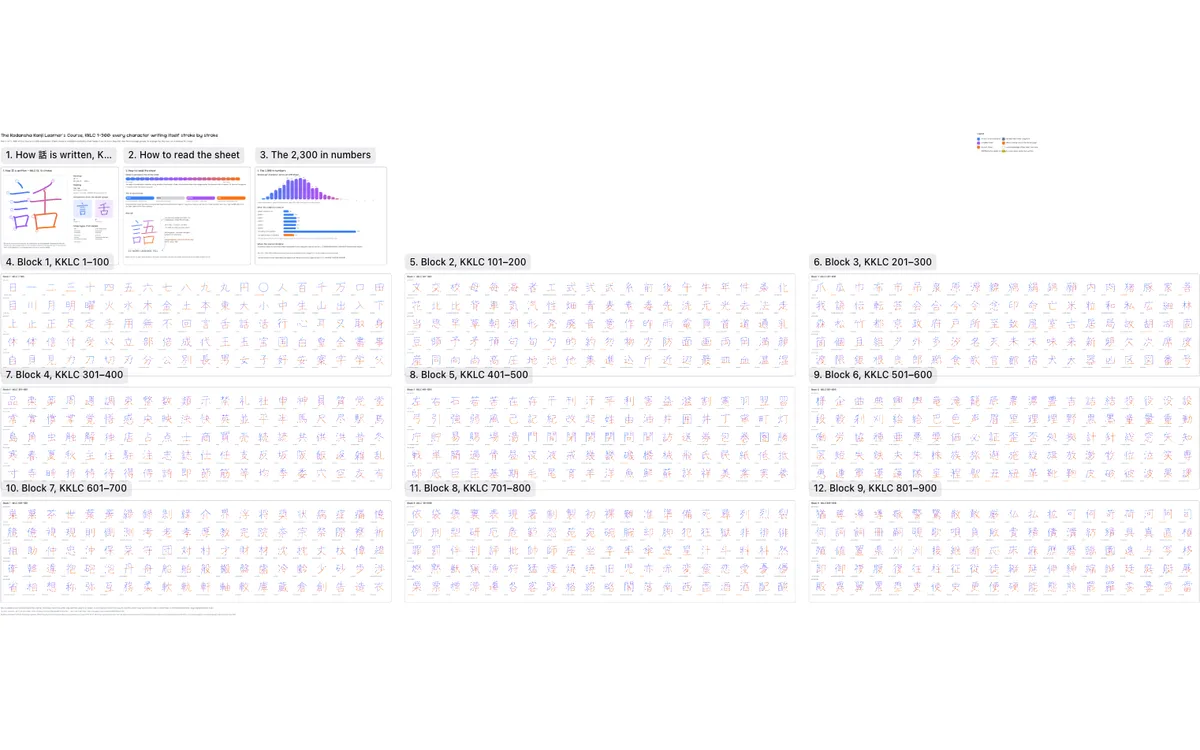
KKLC 1-900: 900 kanji writing themselves
The first 900 characters of the Kodansha Kanji Learner's Course on one sheet, each writing itself stroke by stroke from KanjiVG centrelines, blue for the first stroke through purple to orange for the last. Every cell carries its KKLC index and the book's own keyword, rows follow the course's chapters of twenty, and 話 is drawn large with all 13 strokes numbered beside the stroke-count distribution for the whole course.
Reviewed
For Japanese language learners
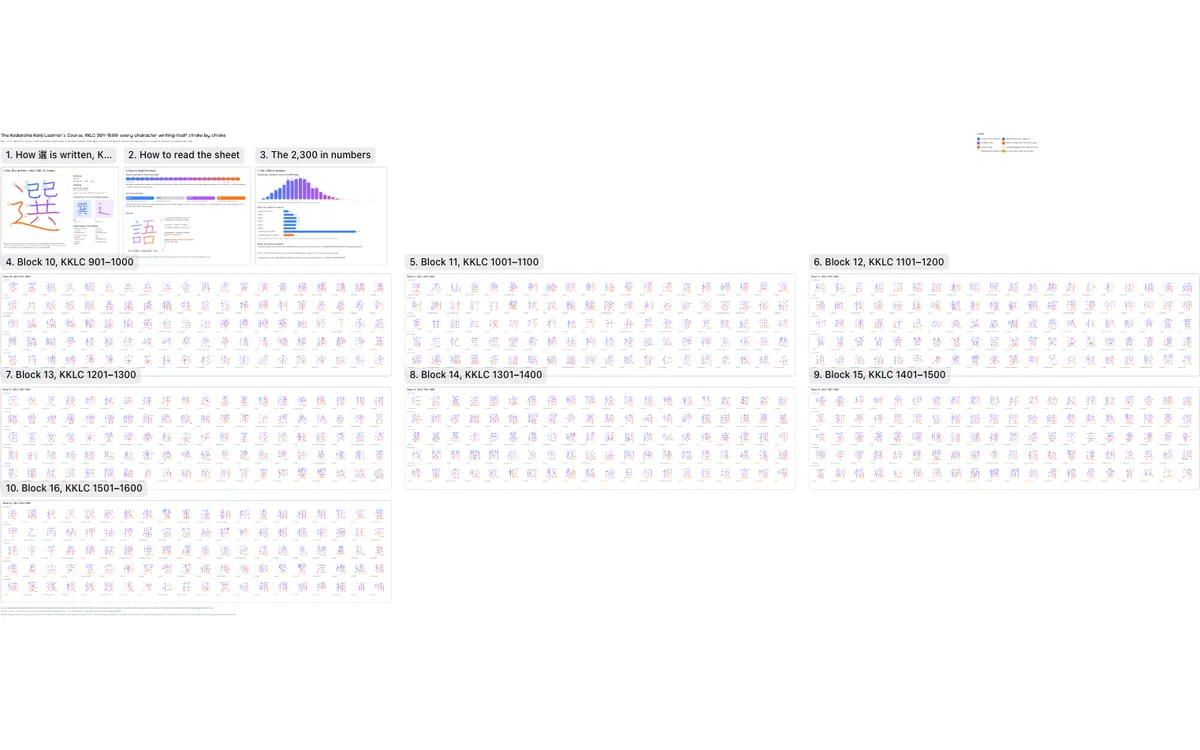
KKLC 901-1600: 700 kanji writing themselves
Part two of the Kodansha Kanji Learner's Course, characters 901 to 1600, each redrawn as KanjiVG centrelines that fade in one stroke at a time in the order a hand writes them. The colour ramp is normalised per character, so the last stroke is orange whether the character takes four strokes or twenty, and 選 leads the sheet with its 15 strokes numbered.
Reviewed
For Japanese language learners
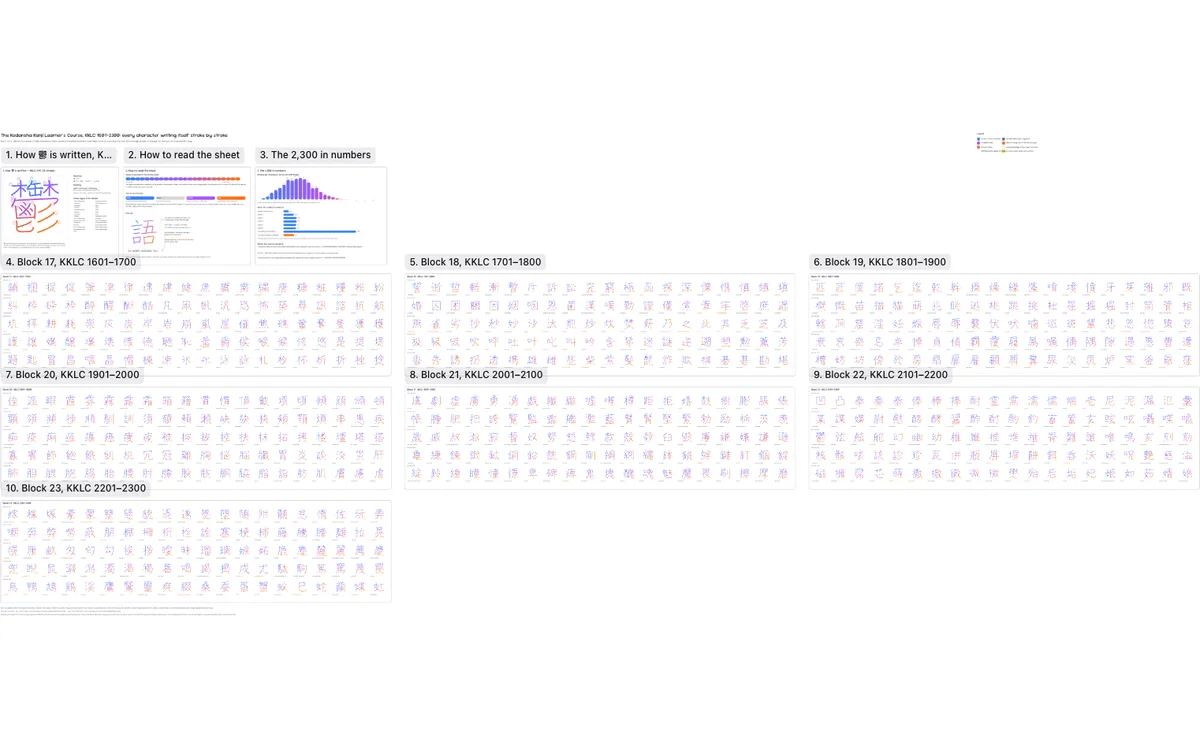
KKLC 1601-2300: 700 kanji writing themselves
The last 700 characters of the Kodansha Kanji Learner's Course, the ones a static chart stops being readable for, each writing itself stroke by stroke with its KKLC index and keyword underneath. 鬱 opens the sheet at 29 strokes, numbered one by one, and the keywords in orange mark the characters that sit outside the jōyō list.
Reviewed
Science
Metabolism in 19 enzyme steps, two cells to label, 206 bones, 118 elements and 88 constellations.
Use case: Drawdy for teaching and tutoring
For biology teachers
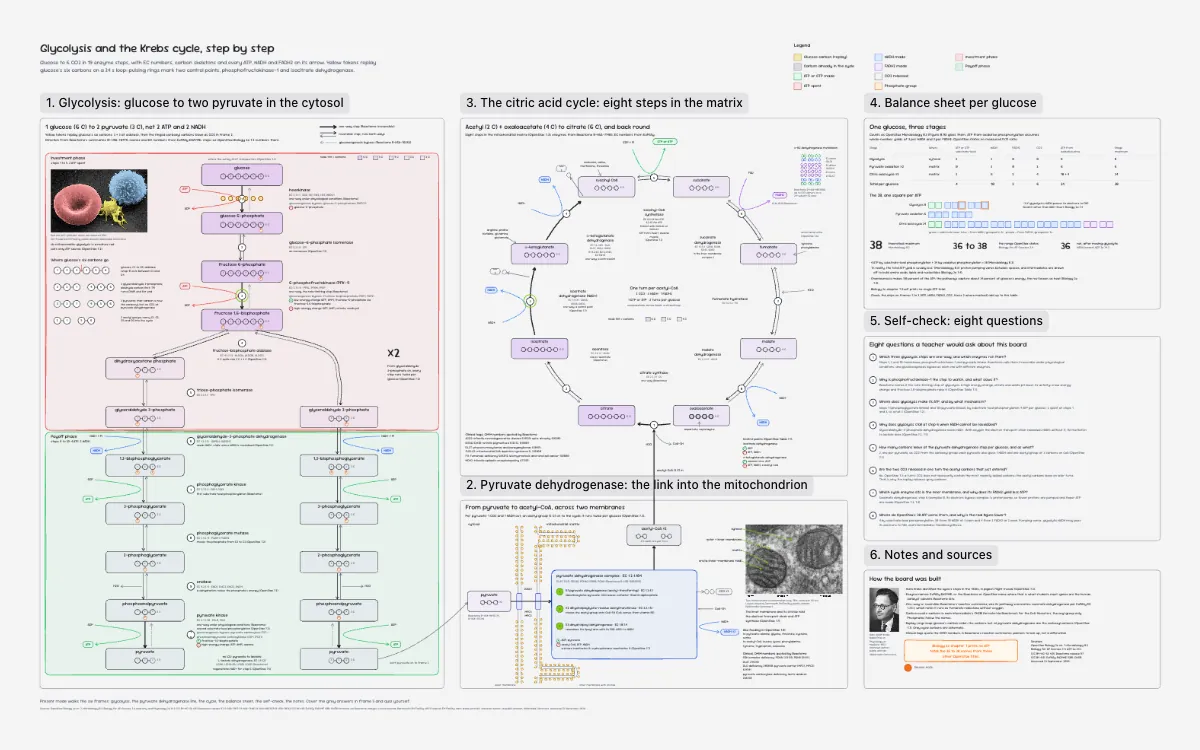
Glycolysis and the Krebs cycle, step by step
Glucose to 6 CO2 in 19 enzyme steps: glycolysis in the cytosol, the pyruvate dehydrogenase link and the eight-step citric acid cycle, each step with its EC number, carbon skeleton and every ATP, NADH and FADH2 on its arrow, from OpenStax, Reactome and ExPASy. A balance sheet totals the yield to a 38 ATP theoretical maximum against OpenStax's range of 36 to 38, and eight self-check questions come with answers to cover.
Reviewed
For secondary science teachers
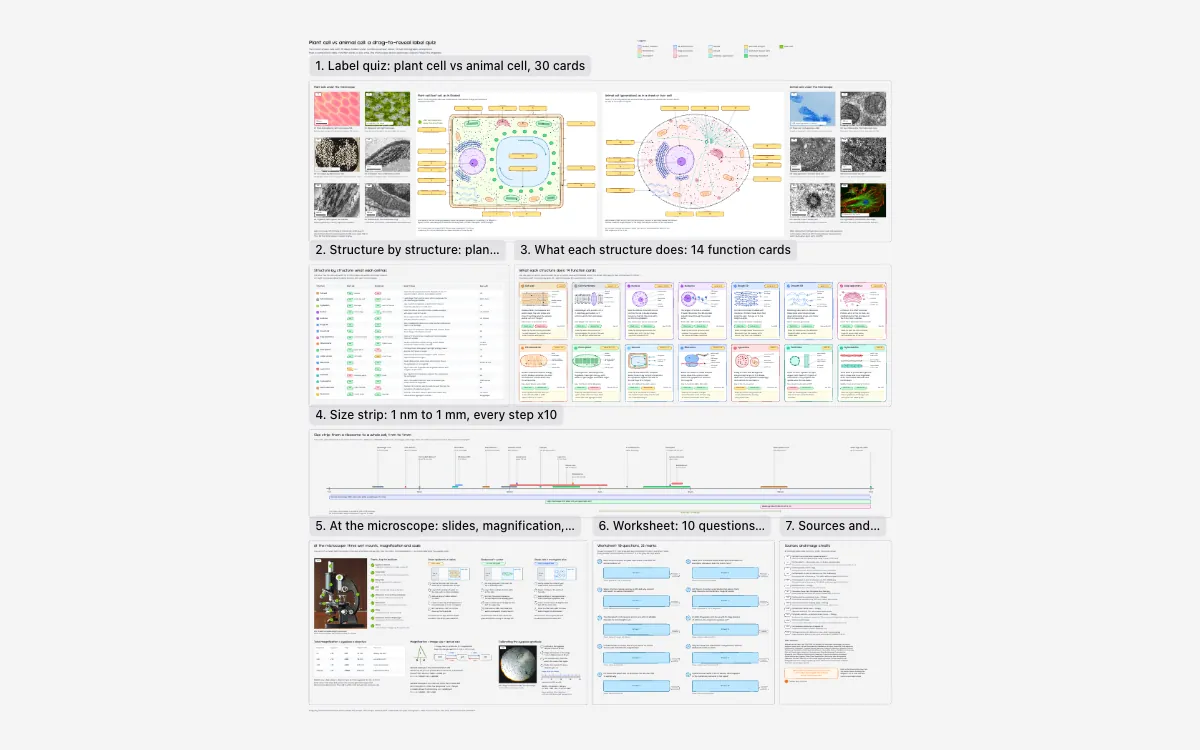
Plant cell vs animal cell: a drag-to-reveal label quiz
A plant leaf cell and an animal cell drawn by hand, with 30 labels hidden under numbered cards that students drag aside to check, beside 14 real micrographs and photos, from onion epidermis to mitochondria under TEM. Then come a 17-row comparison table, 14 function cards, a 1 nm to 1 mm size strip, three wet-mount practicals with the magnification maths, and a 10-question, 22-mark worksheet.
Reviewed
For anatomy students
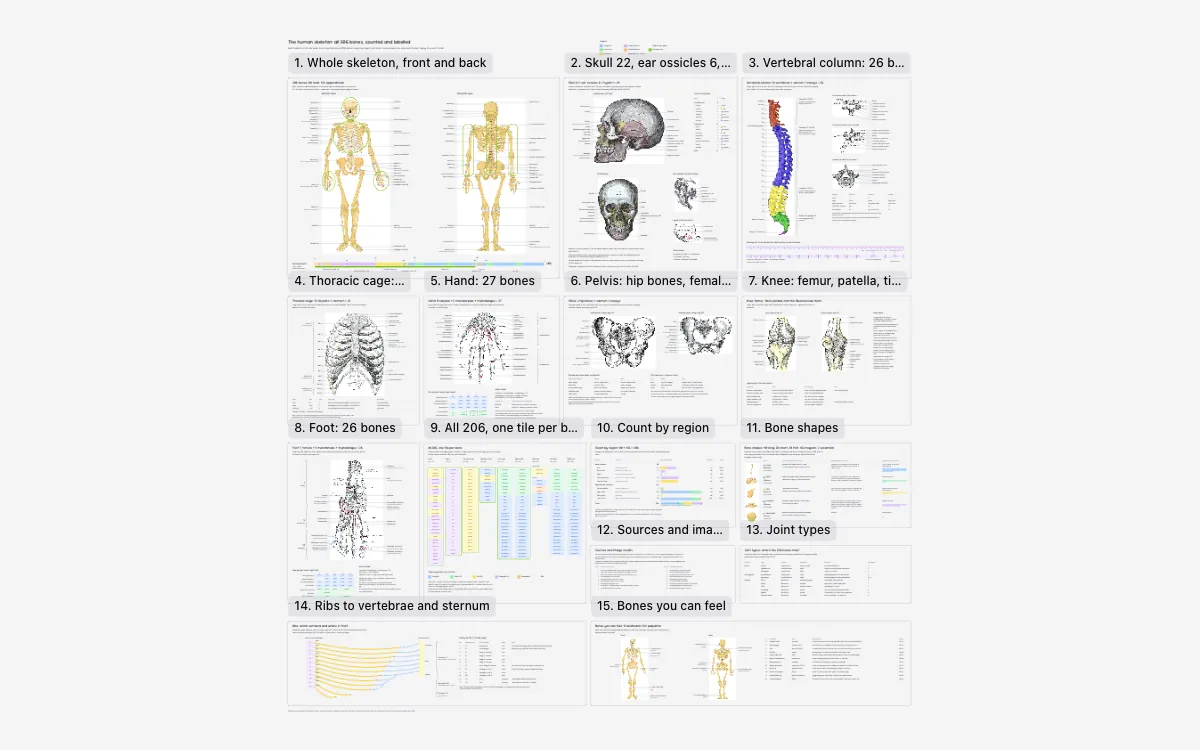
The human skeleton: all 206 bones, counted and labelled
All 206 bones of the adult skeleton, 80 axial and 126 appendicular, labelled on front and back views and then region by region on Gray's Anatomy (1918) plates: skull, vertebral column, thoracic cage, hand, pelvis, knee and foot. Count frames give one tile per bone, totals by region and the five bone shapes (90 long, 30 short, 38 flat, 46 irregular, 2 sesamoid), alongside joint types, rib attachments and 12 landmarks you can feel.
Reviewed
For chemistry teachers
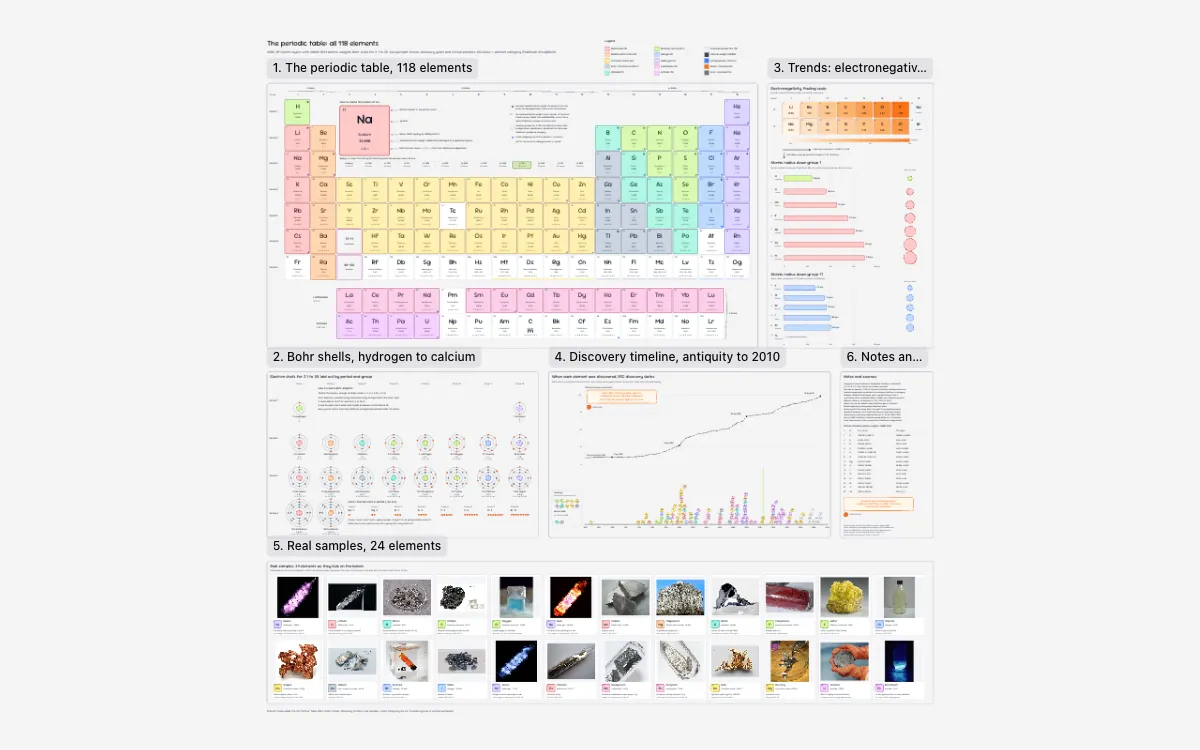
The periodic table: all 118 elements
All 118 elements in the IUPAC 18-column layout, each tile with its CIAAW 2024 standard atomic weight, electrons per shell and PubChem category. Further frames draw Bohr shells for hydrogen to calcium, Pauling electronegativity for periods 2 and 3, atomic radius down groups 1 and 17, the RSC discovery timeline from antiquity to all 118 by 2010, and 24 real samples as they look on the bench.
Reviewed
For amateur astronomers
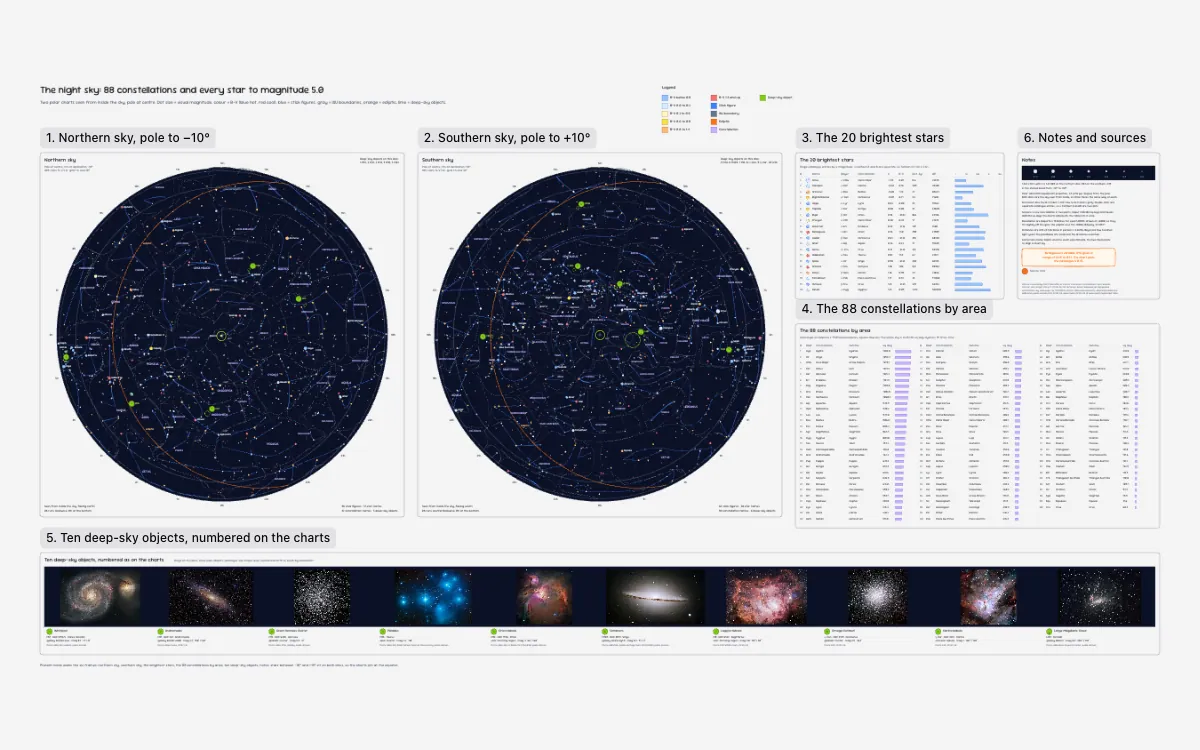
The night sky: 88 constellations
Two polar star charts, northern and southern sky, plot all 1,627 stars to magnitude 5.0, sized by brightness and coloured by B-V index, with stick figures, Delporte's IAU boundaries and the ecliptic, from d3-celestial and HYG v4.1. Tables rank the 20 brightest stars and all 88 constellations by area, Hydra to Crux, and ten deep-sky objects from M51 to the Large Magellanic Cloud get a photo card each.
Reviewed
History and culture
A moon landing on one mission clock, seven centuries of Thai kingdoms, Hesiod's gods and the Indo-European languages on one tree.
For spaceflight historians
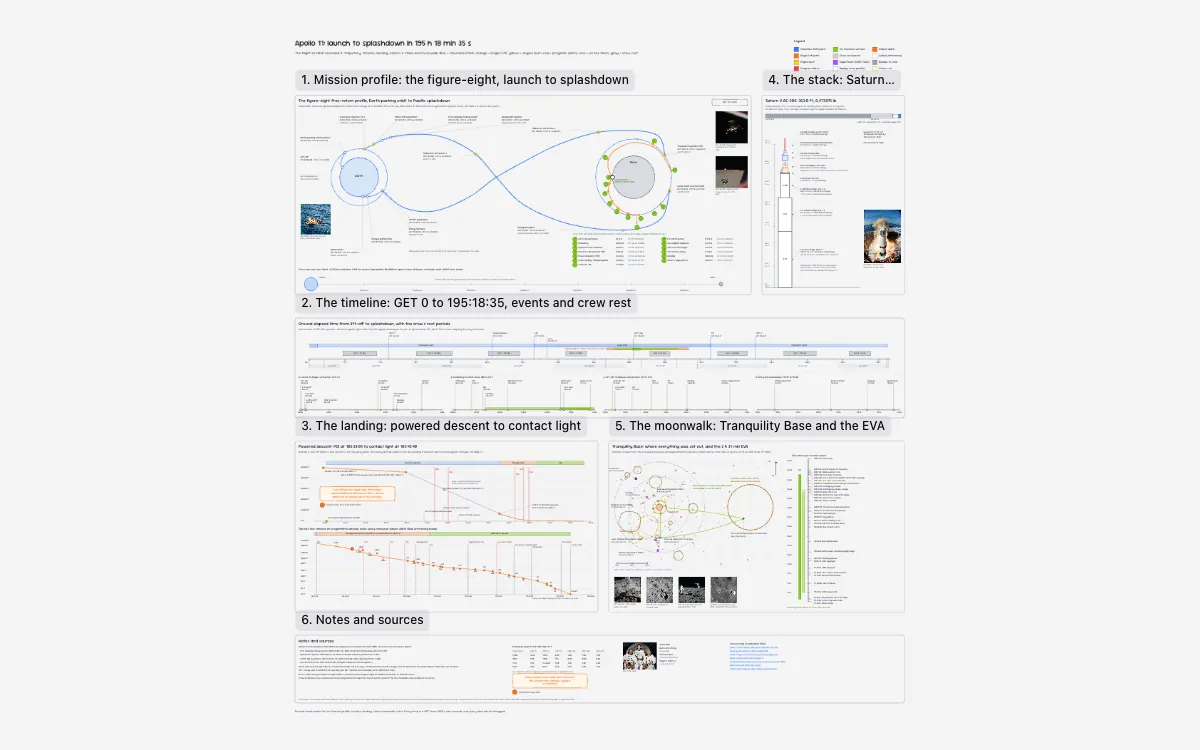
Apollo 11: launch to splashdown in 195 h 18 min 35 s
Apollo 11 from GET 0 to 195:18:35: the figure-eight free-return profile with its engine burns, a timeline with the crew's eight rest periods, the powered descent with its 1202 and 1201 alarms, and the 363 ft Saturn V AS-506 to scale. Tranquility Base is traced from the Pustynski and Jones photogrammetric map beside the 2 h 31 min EVA, and every time is a GET from NASA's own records.
Reviewed
For Thai history teachers
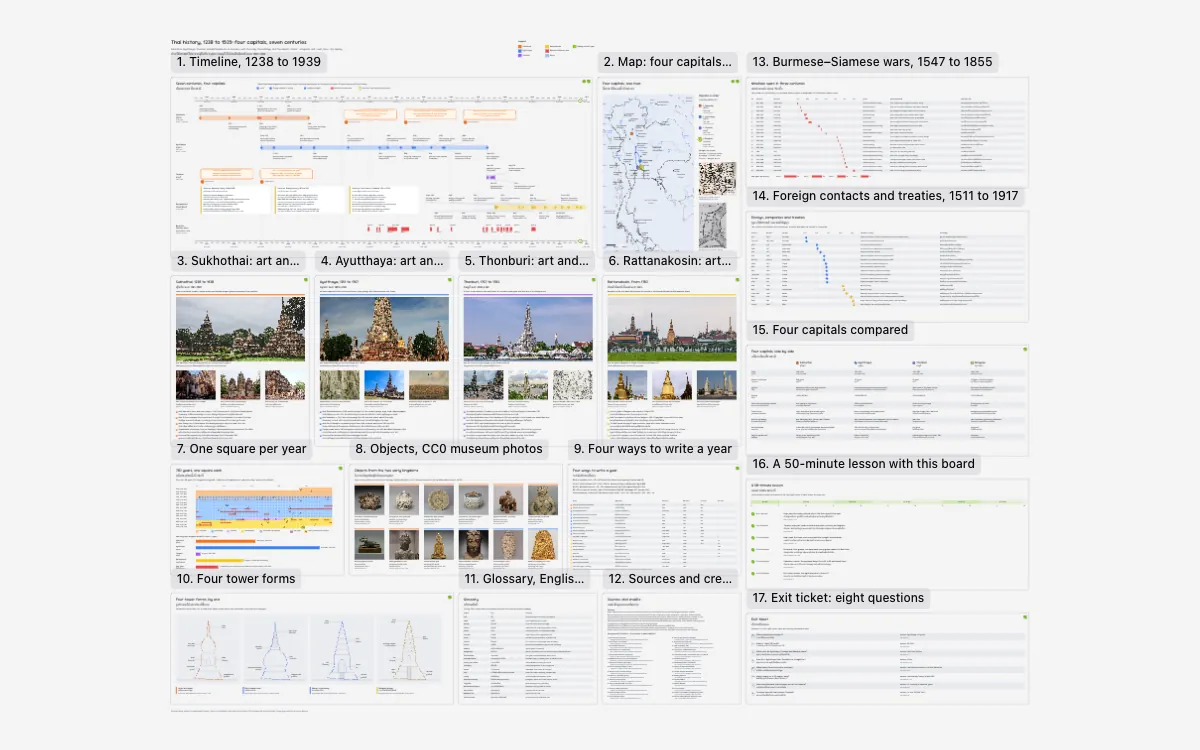
Thai history, 1238 to 1939: four capitals
Sukhothai, Ayutthaya, Thonburi and Rattanakosin on one English and Thai timeline from 1238 to 1939, with the four capitals mapped on the Chao Phraya, the 19 Burmese-Siamese wars from 1547 to 1855, and foreign envoys and treaties from 1511 to 1917. Each kingdom gets an art and architecture frame, followed by CC0 museum objects, four tower forms, CE, BE, CS and RS year systems, a glossary, a 50-minute lesson and an eight-question exit ticket.
Reviewed
For classics teachers
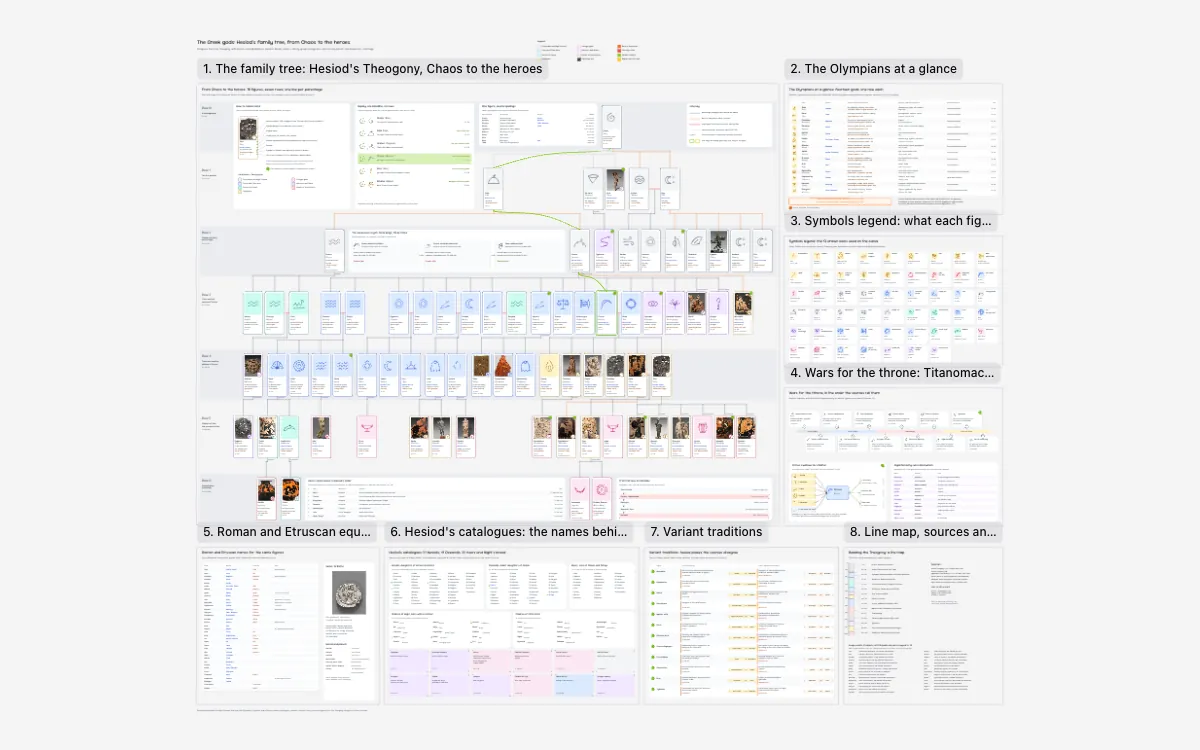
The Greek gods: Hesiod's family tree
Hesiod's Theogony as one family tree: 78 figures on seven rows from Chaos to the heroes, one line per parentage, with Homer's and Apollodorus' variants marked and 29 CC0 museum objects from the Met, Cleveland and Chicago on the cards. Further frames give the fourteen Olympians, the Titanomachy, Gigantomachy and Typhoeus, Roman and Etruscan names, Hesiod's 51 Nereids and 41 Oceanids, twelve disputed points and a line map of the poem's 1,022 lines.
Reviewed
For linguistics students
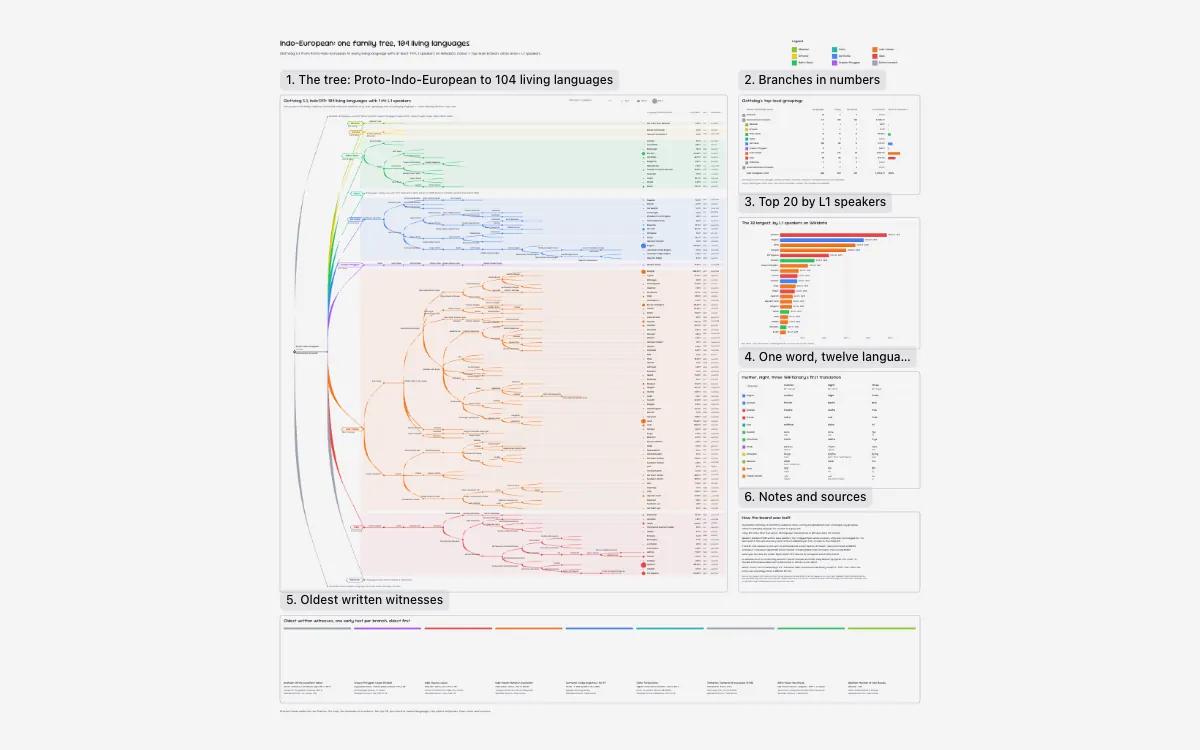
Indo-European: one family tree, 104 living languages
Glottolog 5.3's tree from Proto-Indo-European to all 104 living languages with at least 1 million L1 speakers on Wikidata, each with its Glottocode and speaker count, coloured by top-level branch. Side frames give the branches in numbers, the 20 largest languages led by Spanish at 485 million, the words mother, night and three in twelve languages, and the oldest written witness of nine branches, from a Hittite tablet to Buzuku's 1555 Meshari.
Reviewed
Maps and transit
London's rail network and Tokyo's subway, JFK's runways and taxiways, every M7+ earthquake since 1900 and Thailand's 77 provinces.
For transit planners
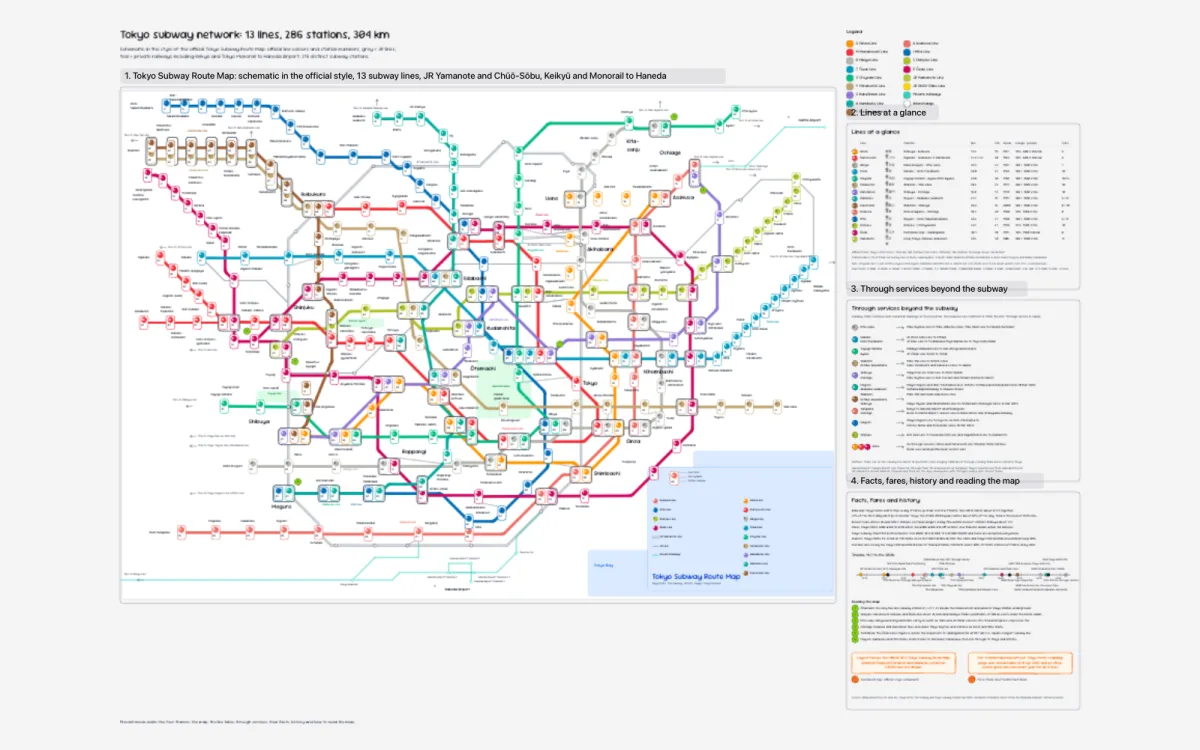
Tokyo transit map: Tokyo Metro and Toei
Thirteen subway lines redrawn in the style of the official Tokyo Subway Route Map: station-number pills, boxed interchanges, the Yamanote loop in grey and the Keikyū and Monorail links to Haneda in teal. Side frames carry the through services, the fares and the history.
Reviewed
For transport planners
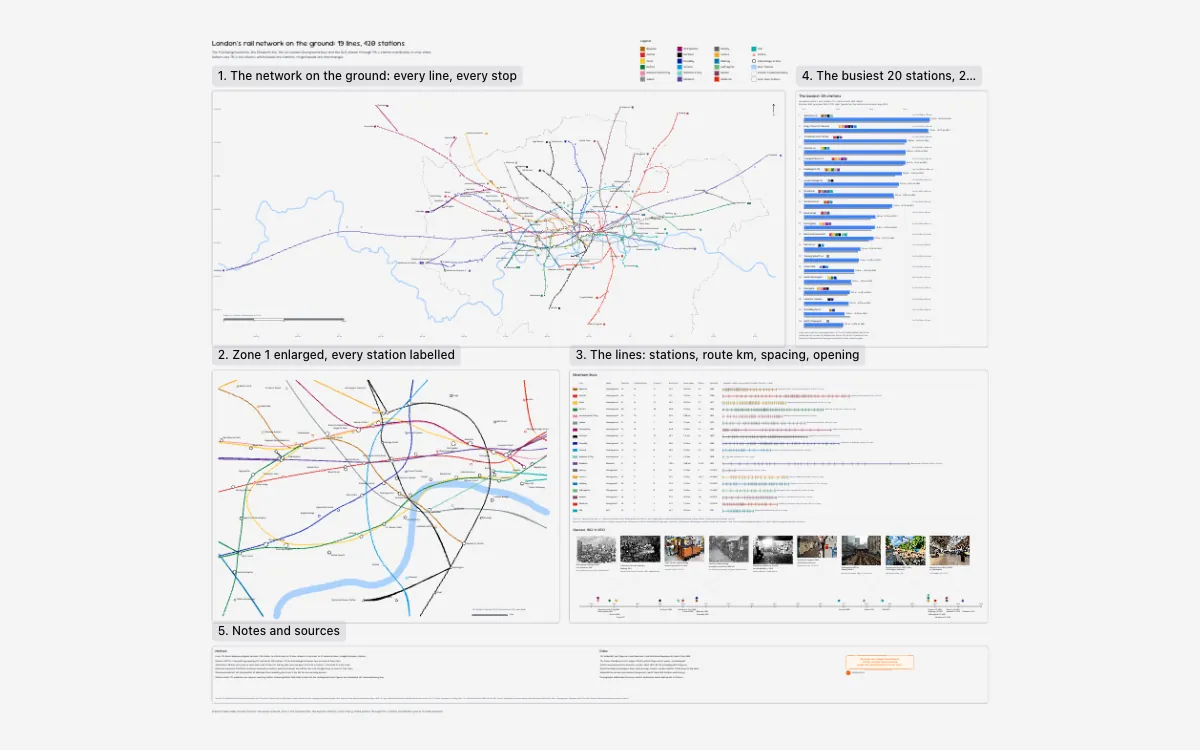
London's rail network: 19 lines, 420 stations
The 11 Underground lines, the Elizabeth line, the six London Overground lines and the DLR drawn through TfL's station coordinates in stop order, 420 stations and 112 interchanges, with zone 1 enlarged and every station labelled. A table gives each line's stations, route km, mean gap and opening year from 1863 to 2022, and the 20 busiest stations of 2025 are ranked by TfL's entry and exit counts, Waterloo first at 74.5 million.
Reviewed
For pilots and dispatchers
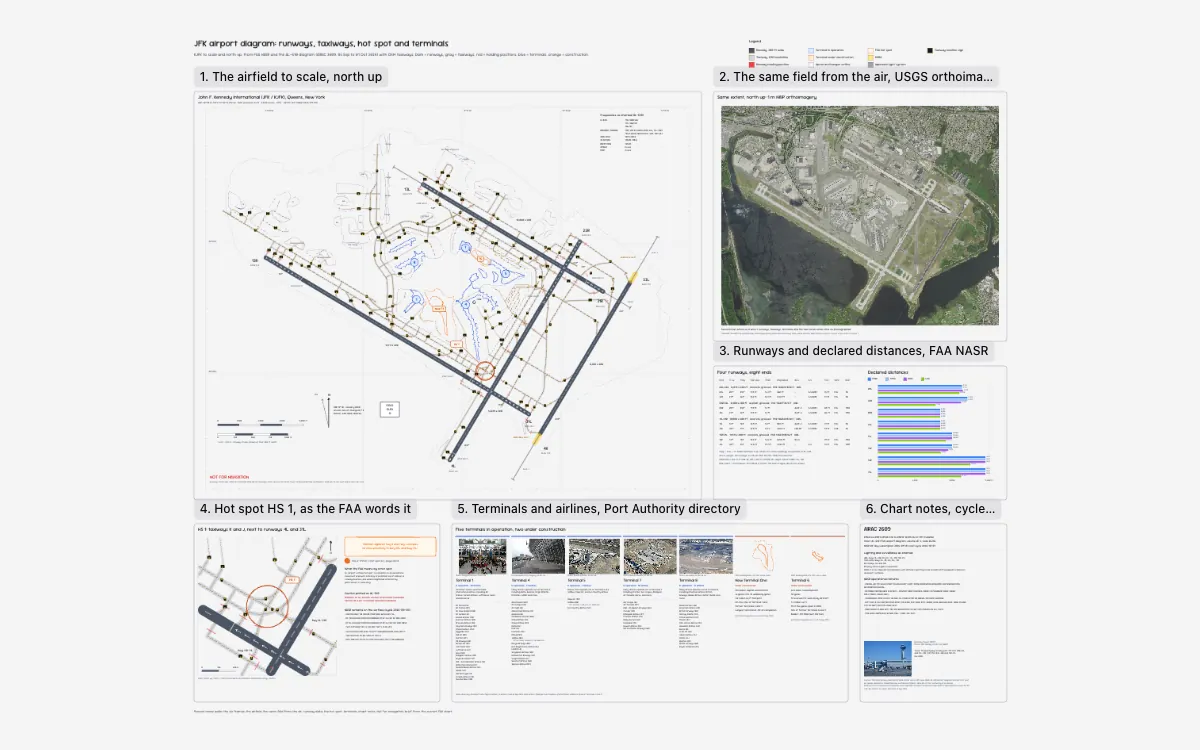
JFK airport diagram: runways, taxiways and terminals
KJFK to scale and north up from FAA NASR and the AL-610 diagram for AIRAC 2609, with OpenStreetMap taxiways, holding positions, EMAS and the HS 1 hot spot at taxiways K and J, beside a 1 m NAIP aerial of the same extent. The four runways' eight ends get declared distances, ILS and lighting, and the five terminals in operation list 74 airlines beside New Terminal One and Terminal 6, both under construction.
Reviewed
For seismologists
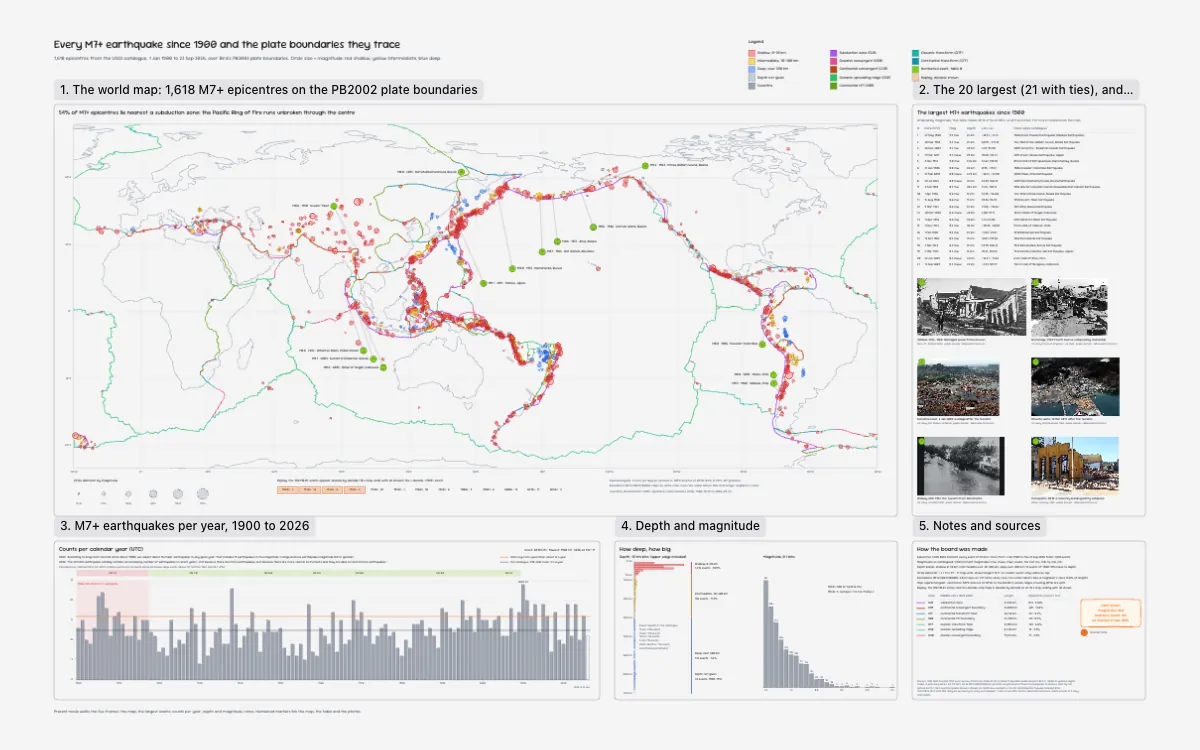
Every M7+ earthquake since 1900, on plate boundaries
All 1,618 M7+ epicentres in USGS ComCat, 1 January 1900 to 23 September 2026, sized by magnitude and coloured by depth over Bird's PB2002 plate boundaries, with the 14 largest numbered on the map. Beside it: the 20 largest (21 with ties) with six photos, counts per year against the USGS expectation of about 16, depth and magnitude histograms, and the share nearest each boundary class, 54% for subduction zones.
Reviewed
For geography teachers
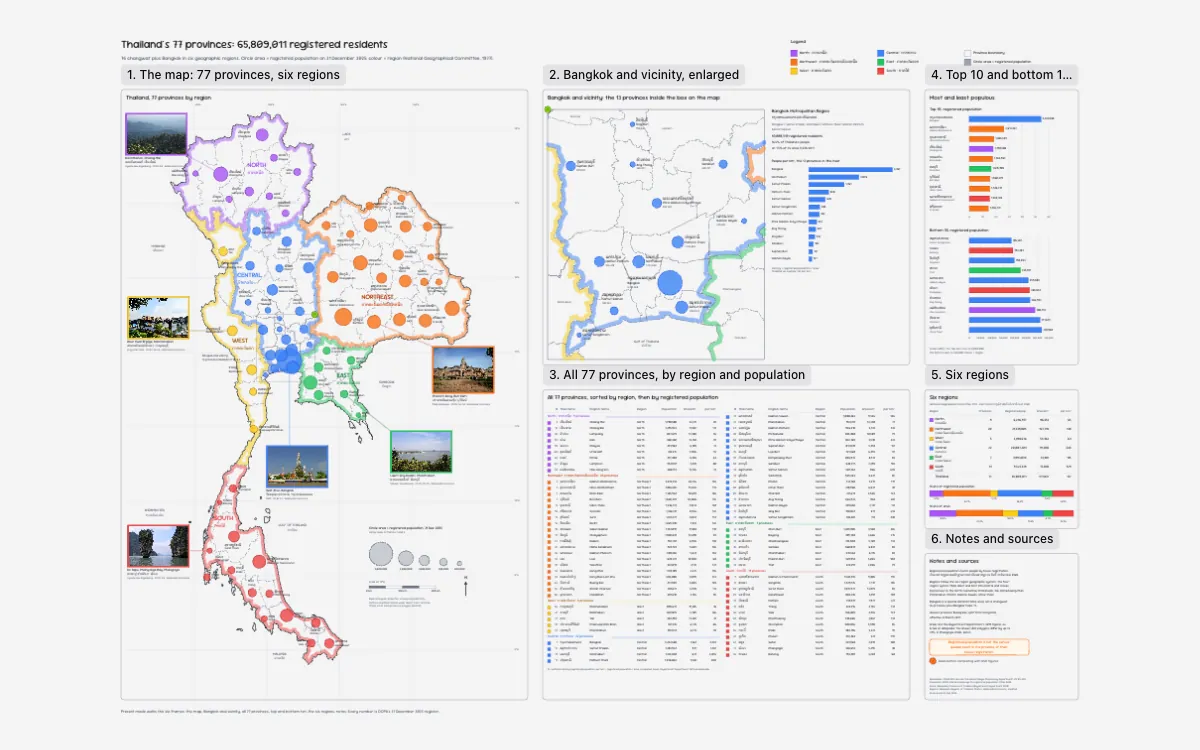
Thailand's 77 provinces by registered population
All 77 provinces, 76 changwat plus Bangkok, mapped in six geographic regions with Thai and English names, each circle sized by registered population from DOPA's 31 December 2025 register: 65,809,011 people. Bangkok and the 12 provinces around it get an enlarged inset with density per km², beside a table of all 77, the top and bottom ten and each region's share of people and area.
Reviewed
Sport
A match in six frames, a race won from P19, forty circuits to scale, every Curry shot of 2015-16, a Grand Slam draw, a Grand Tour and a sub-4 marathon plan.
Use case: Drawdy for presentations
For football analysts
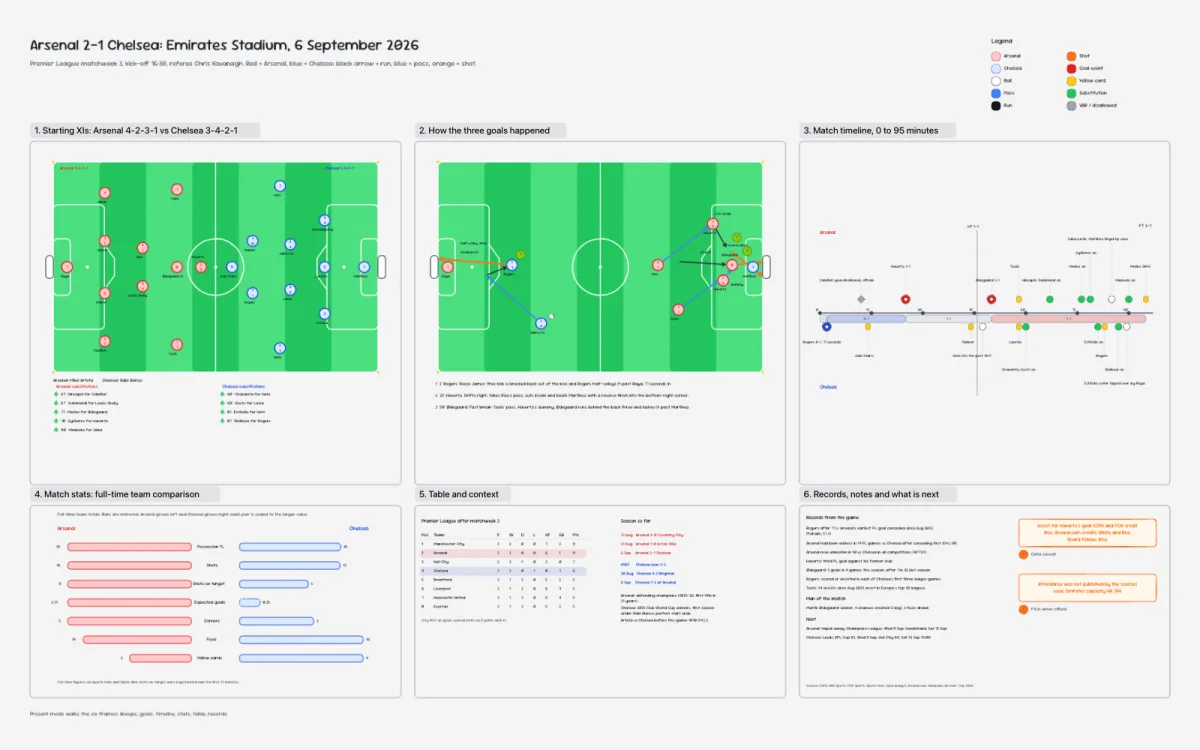
Arsenal 2-1 Chelsea: match analysis
Arsenal 2-1 Chelsea, 6 September 2026, in six frames: the lineups, all three goals drawn on the pitch, a timeline with the substitutions and the VAR call, the stats, the table and the records. Present mode runs it like a post-match briefing.
Reviewed
For race strategists
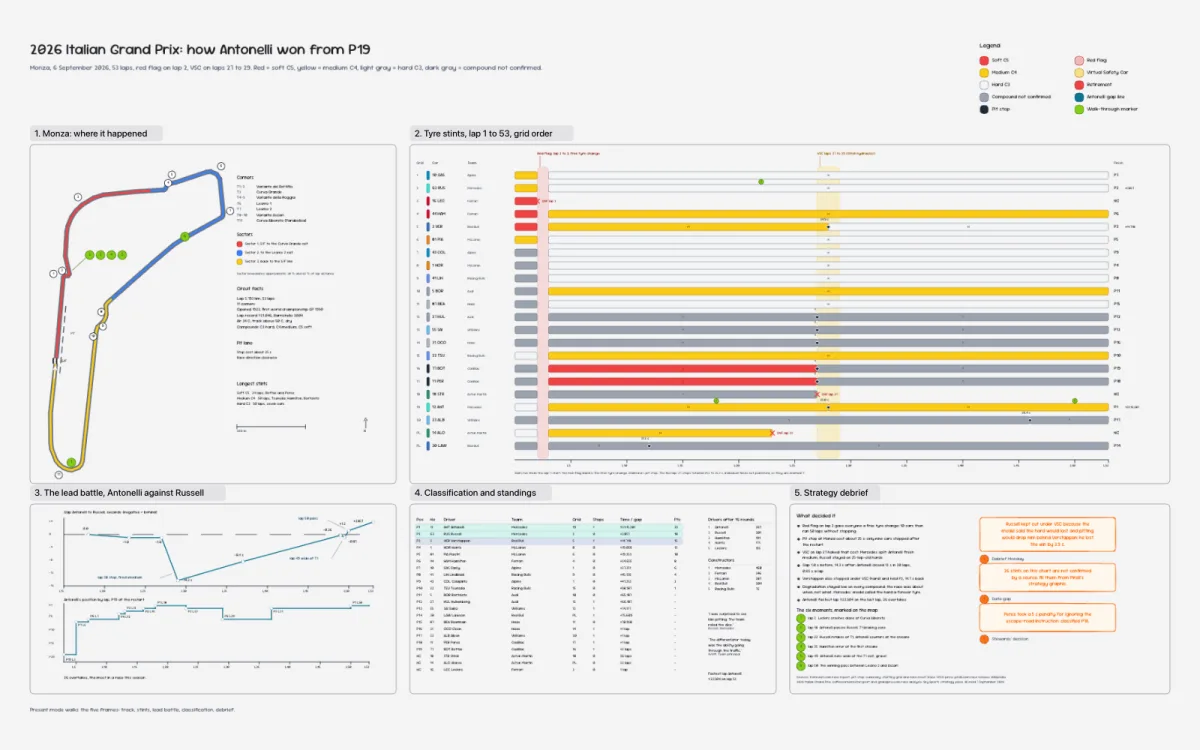
2026 Italian Grand Prix: how Antonelli won from P19
Antonelli from P19 to the win at Monza, lap by lap: every stint by tyre compound, the lap-2 red flag, the virtual safety car on laps 27 to 29, the gap to Russell and all 26 overtakes on one strategy chart. Circuit facts and sector boundaries in the margin.
Reviewed
For motorsport fans
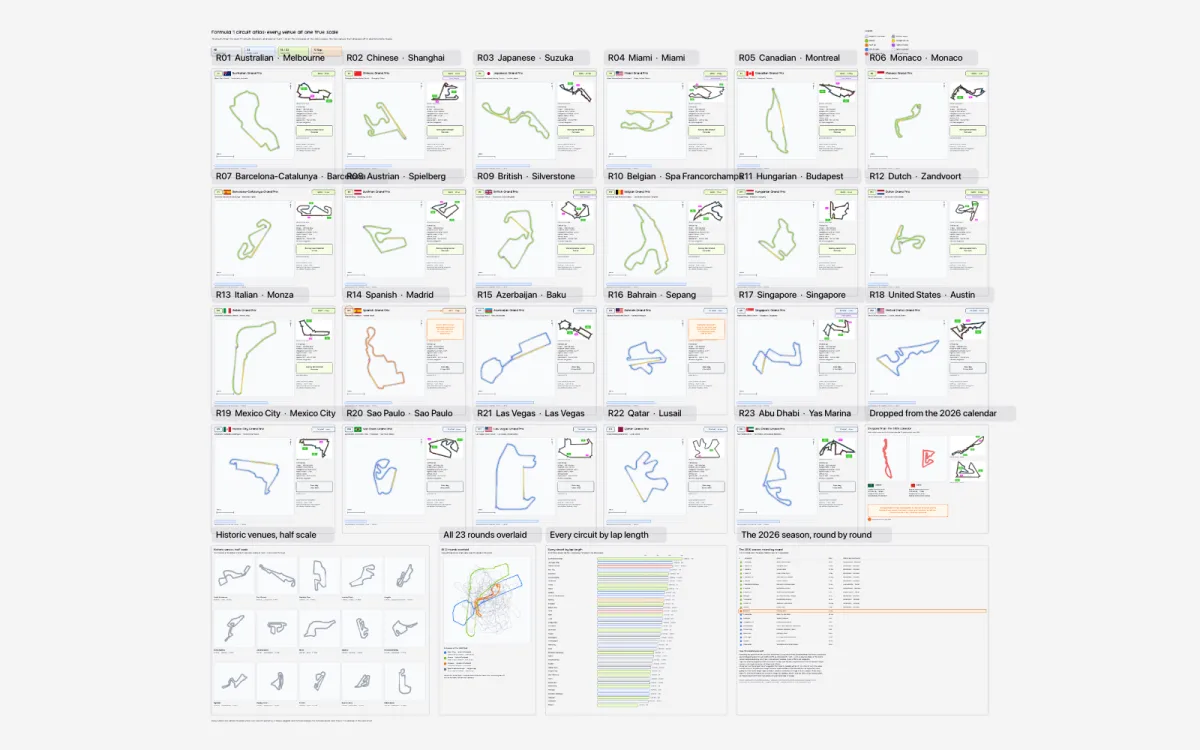
The 2026 Formula 1 circuit atlas
All 40 circuits traced from OpenStreetMap, north up: the 23 rounds of 2026 as a card each, the two venues dropped from the calendar and 15 historic tracks at half scale, the rest at true scale. Every round card gives lap length, race distance, straightest run, tightest radius and altitude, and the summary frames overlay all 23 laps on one origin.
Reviewed
For basketball analysts
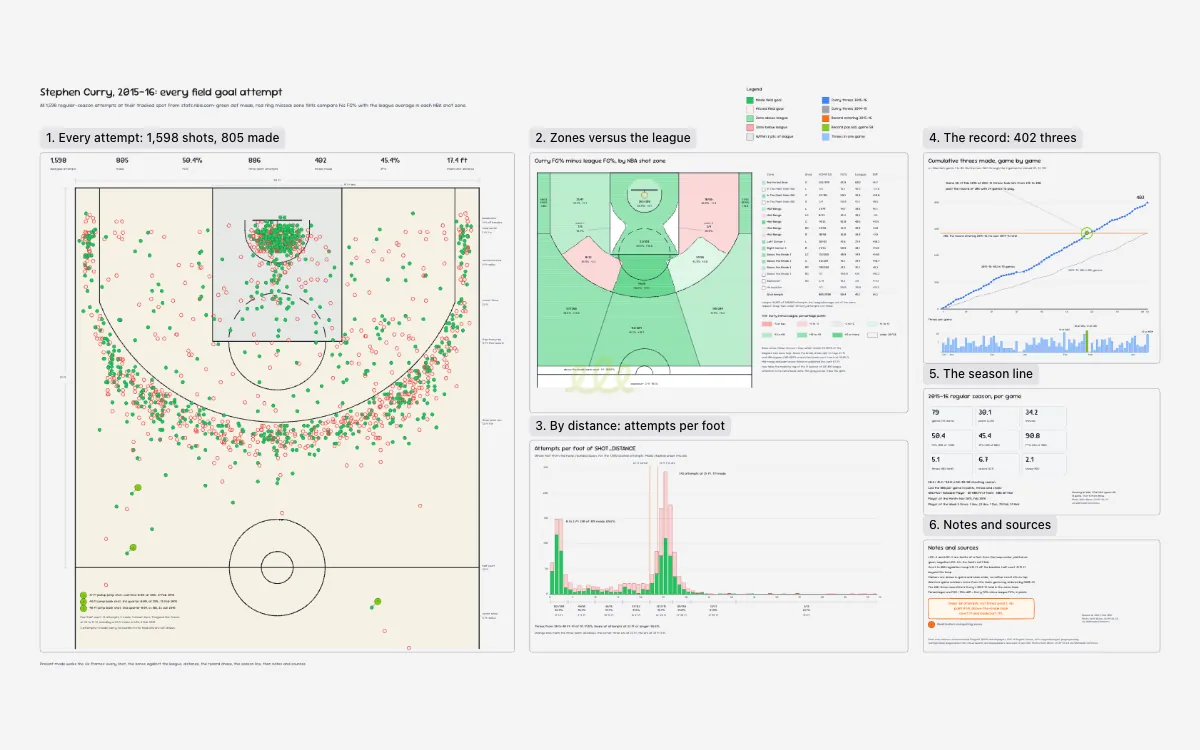
Stephen Curry, 2015-16: every field goal attempt
All 1,598 of Stephen Curry's 2015-16 regular-season field goal attempts plotted at their tracked spot from stats.nba.com, 805 made, with each NBA shot zone tinted by his FG% against the league average. Attempts per foot of distance, the game-by-game climb to 402 threes past his own record of 286 in game 58 at OKC, and the 50-40-90 season line complete the board.
Reviewed
For tennis analysts
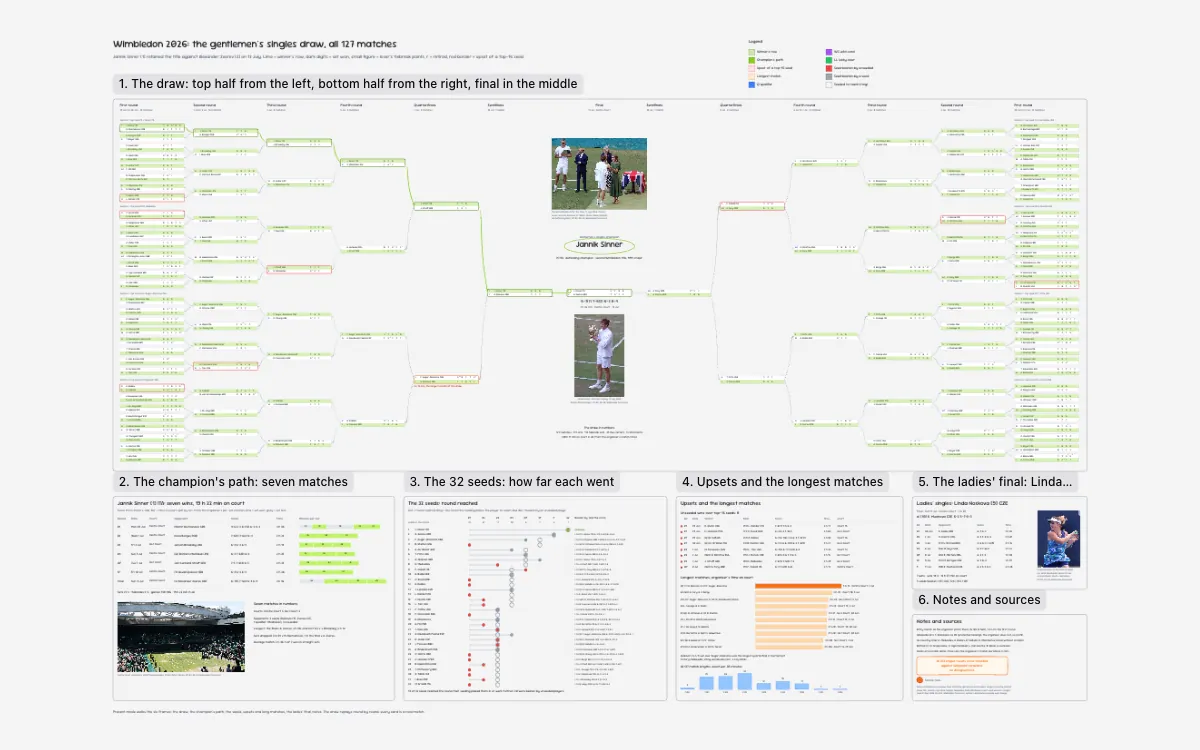
Wimbledon 2026: the gentlemen's singles draw
All 127 matches of the Wimbledon 2026 gentlemen's singles draw, every set score with tiebreak points, retirements and upsets of top-16 seeds marked, ending with top seed Jannik Sinner retaining the title against Alexander Zverev on 12 July. Alongside: Sinner's seven matches set by set, how far each of the 32 seeds went, the eight unseeded wins over top-16 seeds, Djokovic's 5 h 15 quarterfinal and Linda Noskova's run to the ladies' title.
Reviewed
For cycling fans
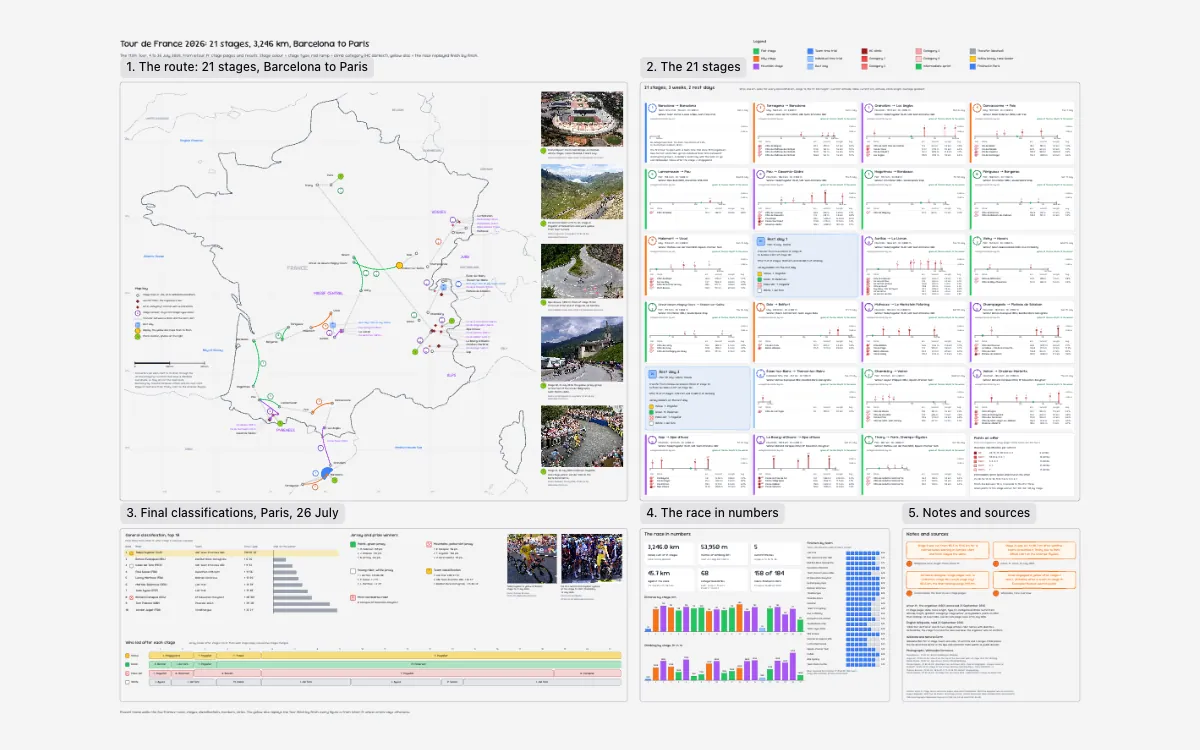
Tour de France 2026: 21 stages, Barcelona to Paris
The 113th Tour de France, 4 to 26 July 2026, from letour.fr: the route from Barcelona to Paris through its HC and category 1 summits, and a card per stage with profile, climbs, winner and green points. Tadej Pogačar's win by 6 min 26 s over Remco Evenepoel heads the final classifications, beside the jersey holders after every stage, 3,246 km, 53,950 m of climbing and 158 of 184 riders finishing in Paris.
Reviewed
For running coaches
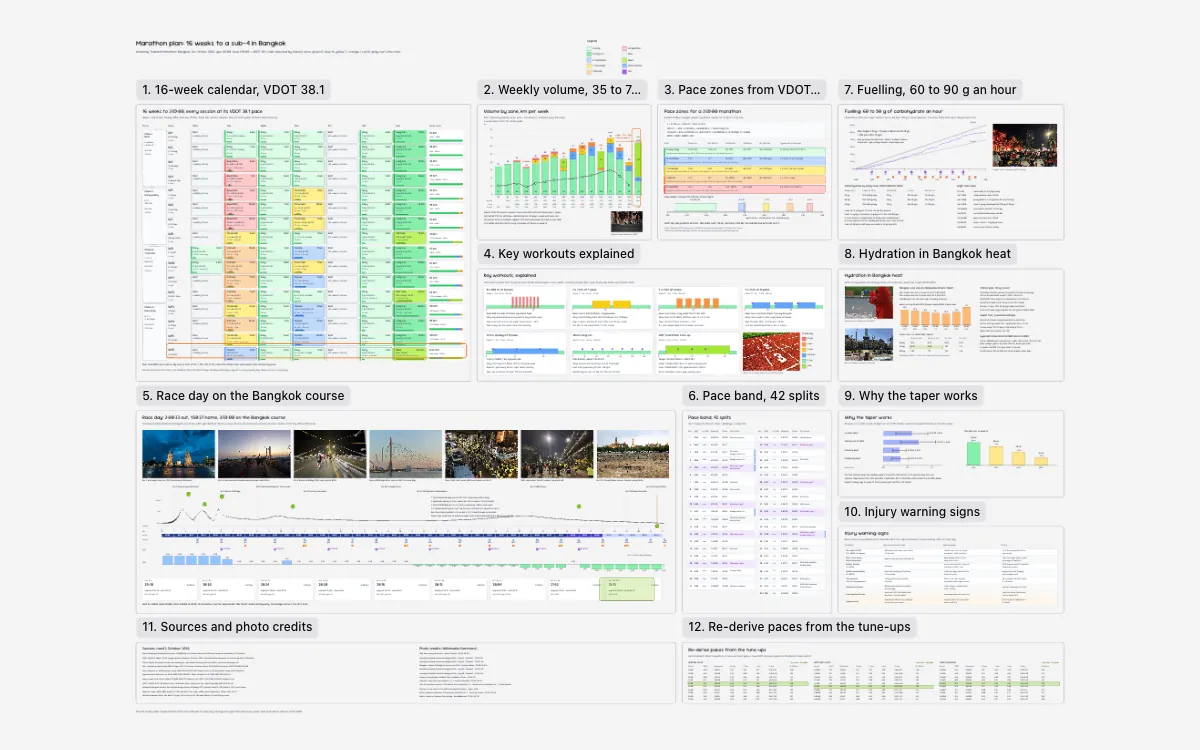
Marathon plan: 16 weeks to a sub-4 in Bangkok
A 16-week plan for a 3:59:00 finish at the Amazing Thailand Marathon Bangkok, 29 November 2026: every session at its Daniels pace for VDOT 38.1, 809 km in all, peaking at 70 km a week before a three-week taper. The course's bridges and 20 drink stations feed a 42-split pace band for the 02:00 gun, beside gel and fluid plans, injury warning signs and pace tables for the 10K and half tune-ups.
Reviewed
Chess
Two famous games on three boards, and a year of master games branched to four plies.
For chess coaches
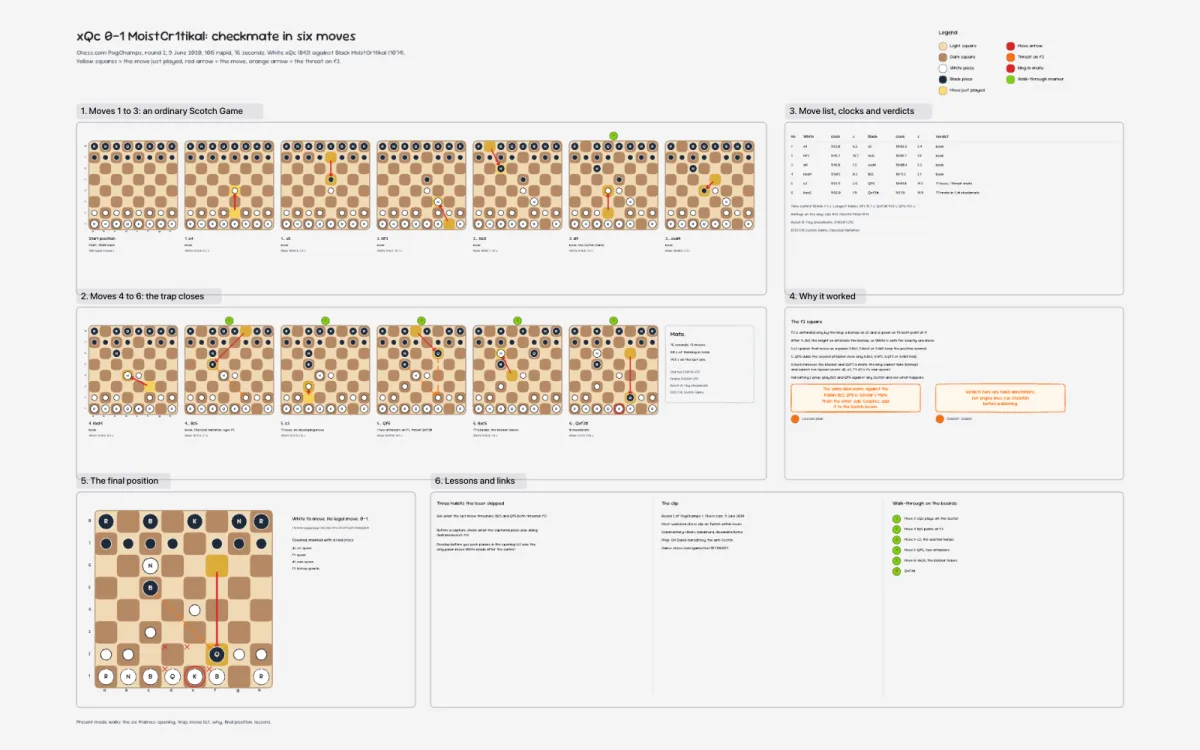
xQc 0-1 MoistCr1tikal: checkmate in six
Twelve half-moves in 76 seconds: the PogChamps 2020 game xQc lost in six, with a diagram per move, both clocks running, and annotations on the loose move and the blunder that opened f2. Walk it frame by frame.
Reviewed
For chess coaches
The Game of the Century: Byrne 0-1 Fischer
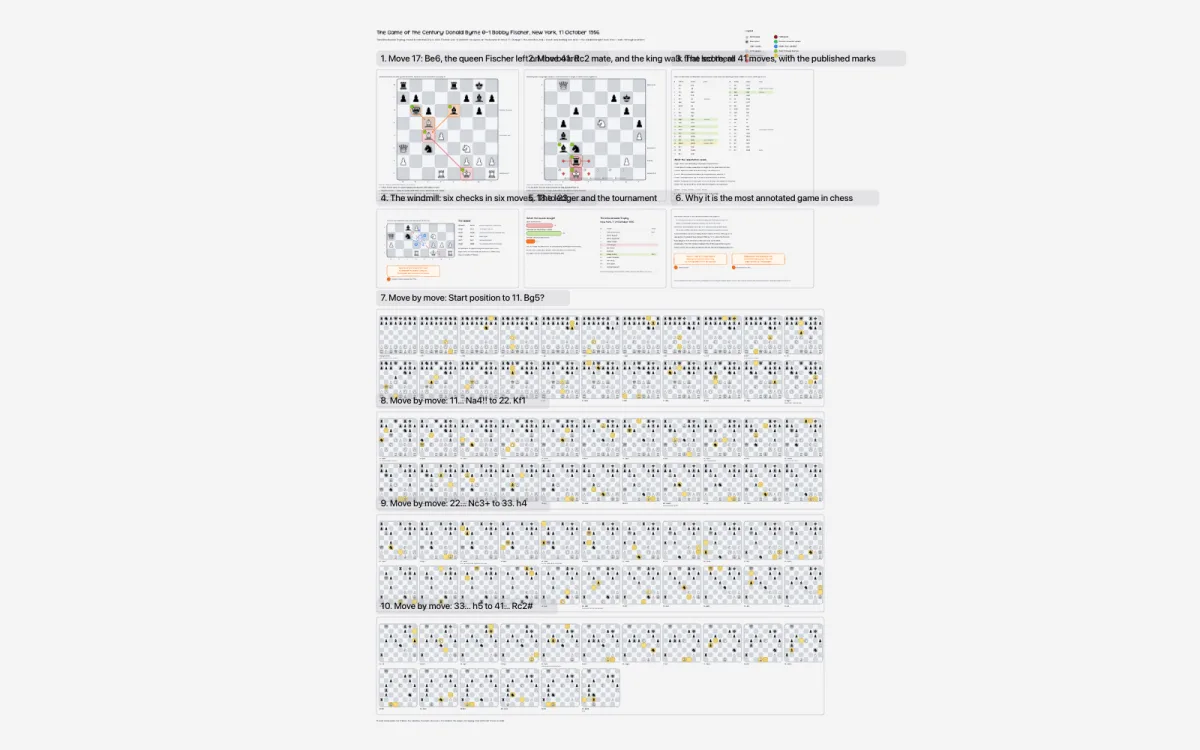
Donald Byrne against 13-year-old Bobby Fischer, New York, 17 October 1956: the Grünfeld, 17...Be6!! leaving the queen en prise, the windmill knight tour and 41...Rc2 mate, each on its own diagram. All 41 move pairs, the closing material ledger and the sources are on the board.
Reviewed
For chess coaches
Byrne vs Fischer 1956, animated in three acts
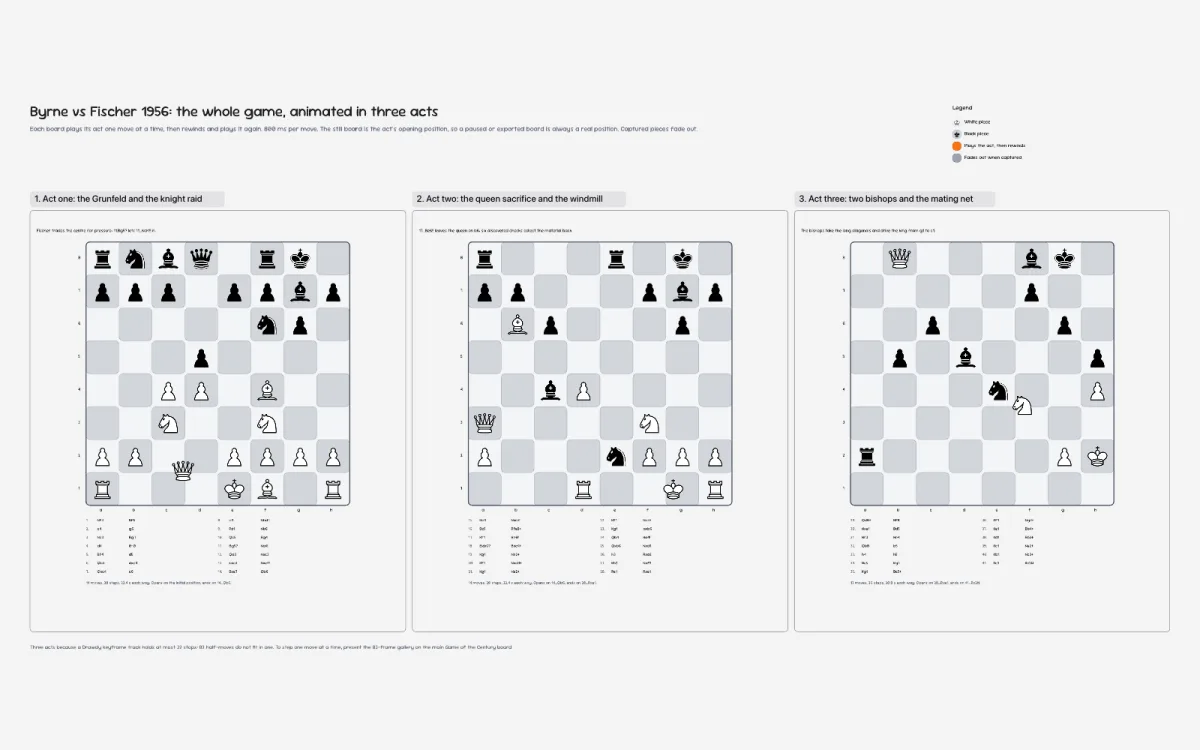
The Game of the Century as three boards that play themselves, one act each at 800 ms a move, then rewind: the knight raid, the queen sacrifice and the windmill, then the mating net. Pause anywhere and the board is a real position, with captured pieces fading as they go.
Reviewed
For club chess players
The chess opening tree: four moves at master level
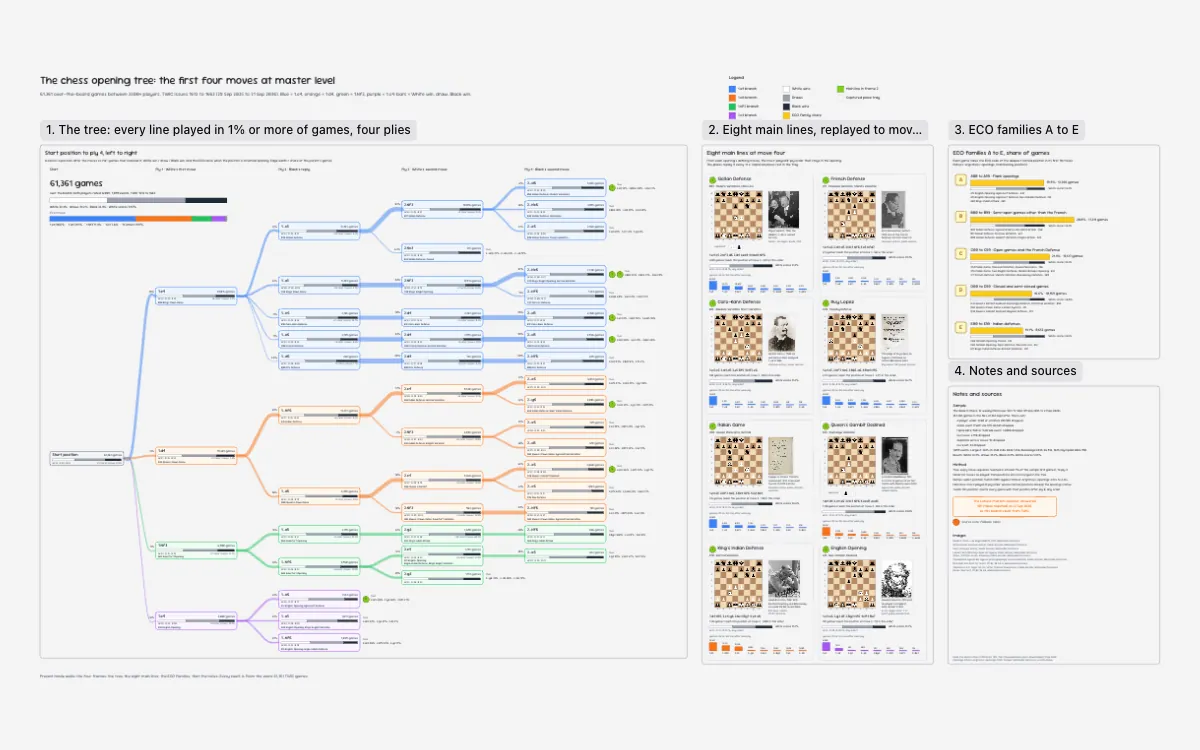
Every opening line played in at least 1 % of 61,361 over-the-board games between 2200+ players, from The Week in Chess issues 1612 to 1663 (29 Sep 2025 to 21 Sep 2026), branched from the start position to ply 4 with White win, draw and Black win shares. Eight main lines, from the Sicilian to the English Opening, replay to move four, and the ECO families A to E show their share of games.
Reviewed
Markets and money
Sixty years of one performance table, three days of a crash, the US yield curve since 1990 and where one Bangkok salary goes.
Use case: Drawdy for presentations
For investors
Berkshire vs the S&P 500: sixty years
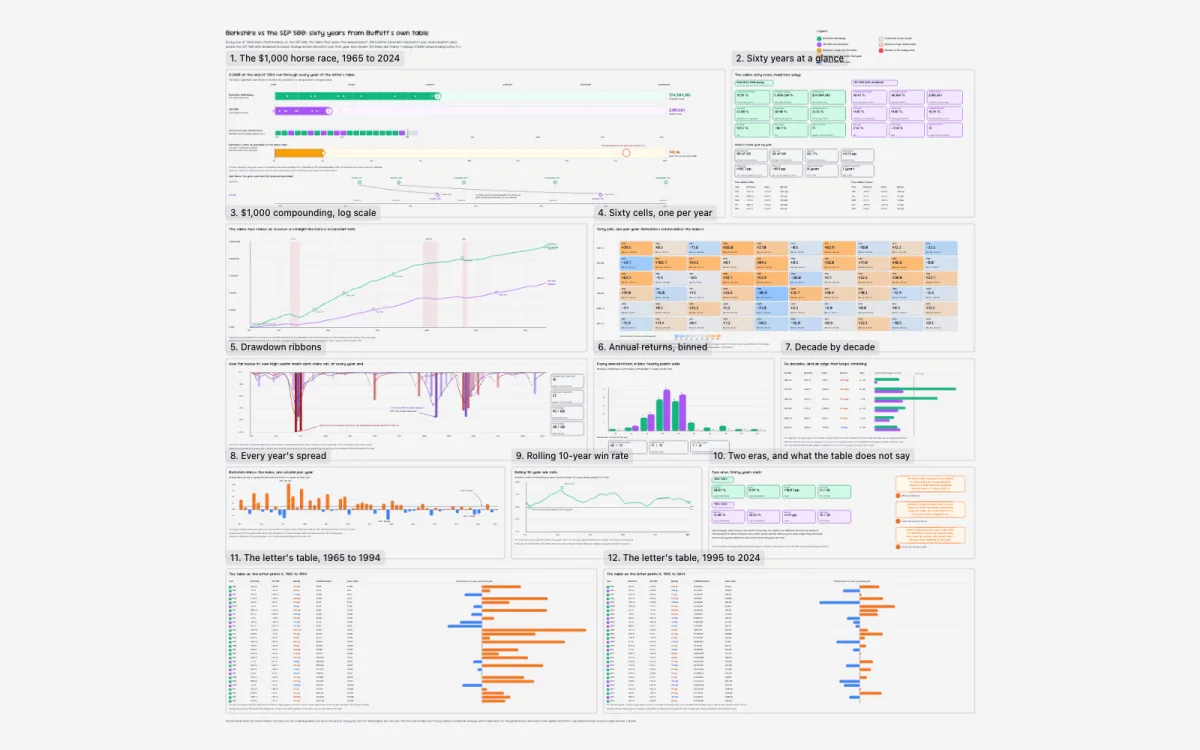
$1,000 in Berkshire against $1,000 in the S&P 500, 1965 to 2024, racing on a log track: every row of the table that opens the annual report, the year each stake passed $10,000 and $1,000,000, drawdowns from each stake's own high, and sixty years coloured by who won. The edge runs +26.74 points a year in 1975-84 and -1.45 in 2015-24.
Reviewed
For macro traders
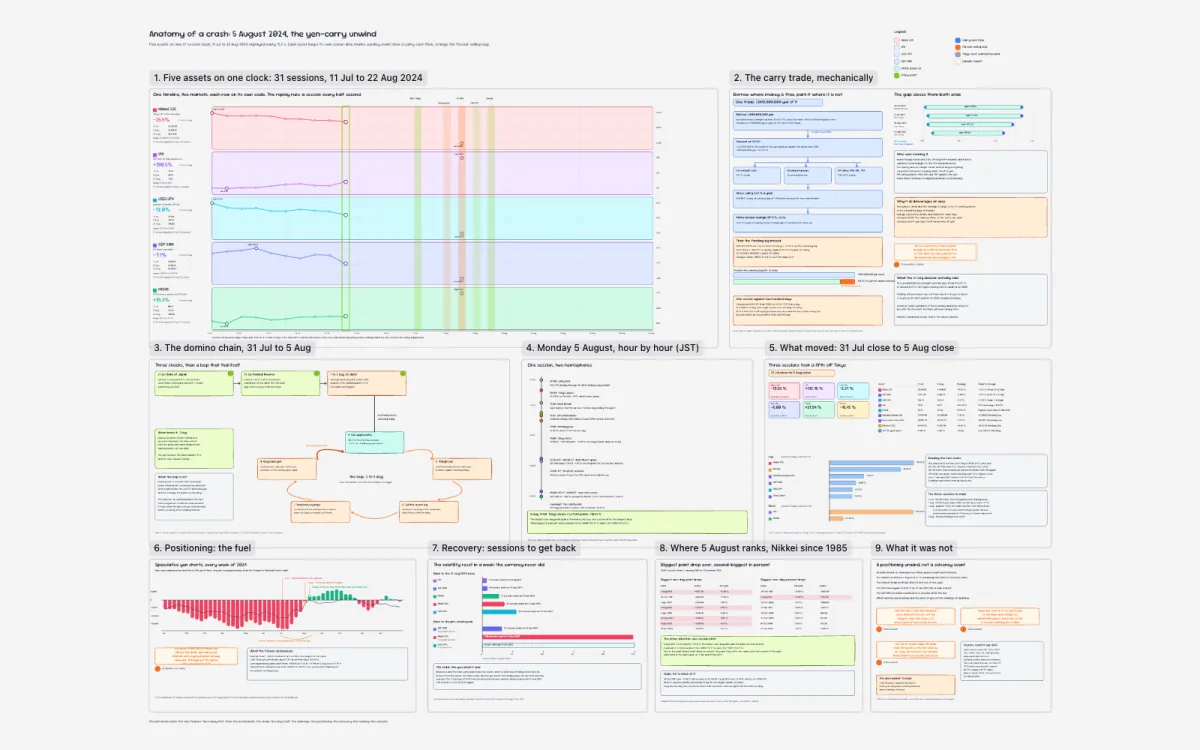
Anatomy of a crash: 5 August 2024
Five markets on one 31-session clock, 11 July to 22 August 2024, replayed a session every half second: the Bank of Japan hike to 0.25 %, the Nikkei's record 4,451-point drop, a VIX print of 65.73, and CFTC positioning flipping from 184,223 contracts net short to net long. Nine frames run from the carry mechanics to the recovery and the caveats.
Reviewed
For fixed-income analysts
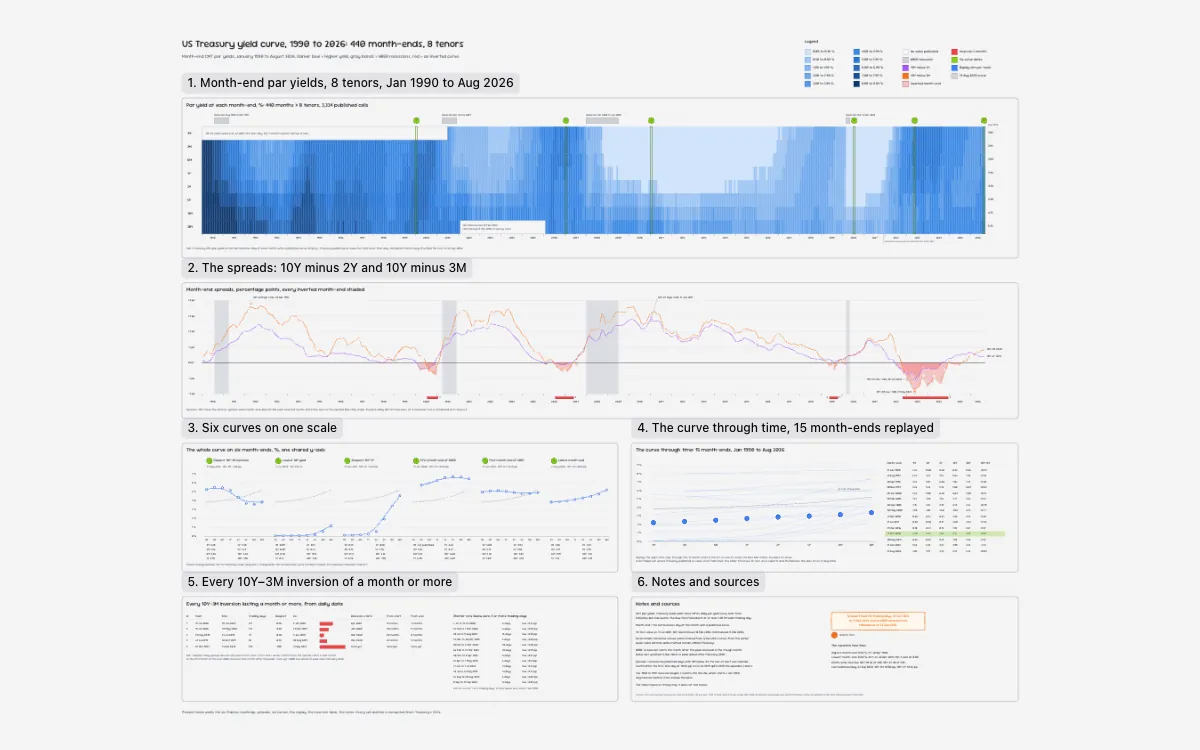
US Treasury yield curve, 1990 to 2026: 440 month-ends
Month-end Treasury CMT par yields for eight tenors, January 1990 to August 2026, as a 440-month heatmap with NBER recessions banded, and the 10Y minus 2Y and 10Y minus 3M spreads with every inverted month-end shaded. Six curves share one scale, and a table times the five 10Y minus 3M inversions of a month or more against the next NBER recession; none has followed the latest, October 2022 to December 2024.
Reviewed
For financial planners
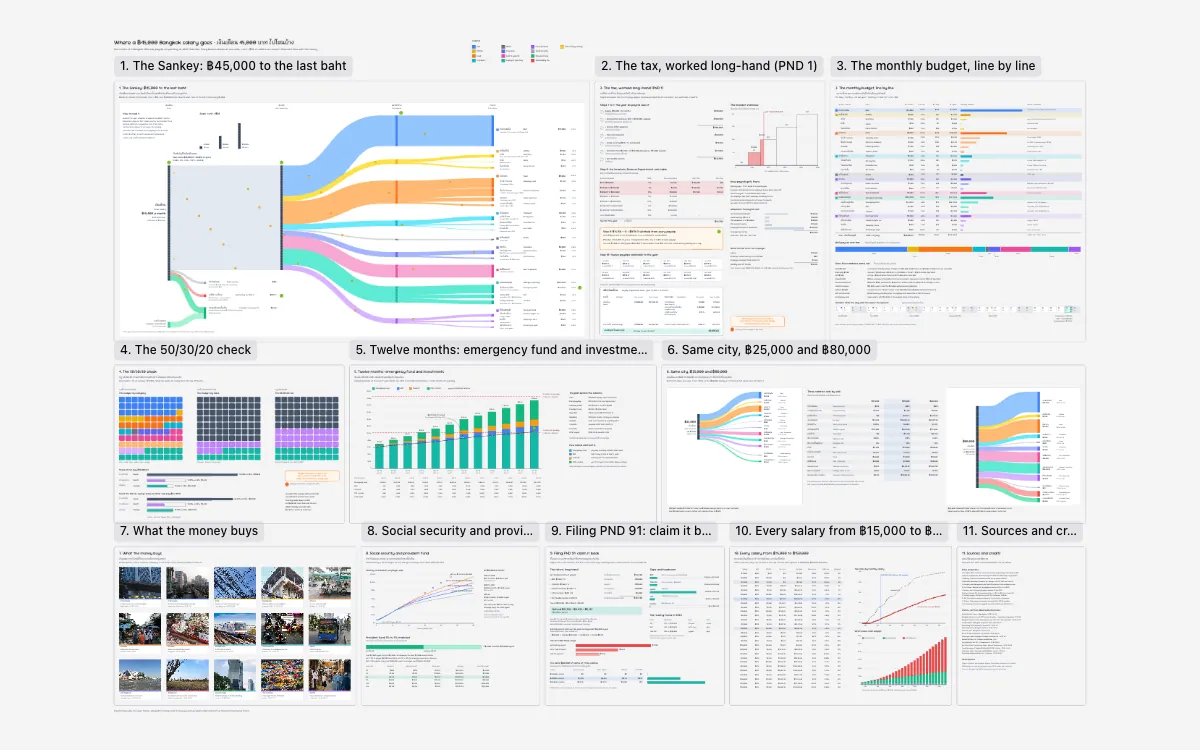
Where a ฿45,000 Bangkok salary goes
One month of a ฿45,000 Bangkok office salary under 2026 Thai rules as a Sankey: social security, provident fund and ฿979.17 withholding tax drop out, then ฿40,895.83 take-home splits into 21 line items, from ฿12,000 rent near BTS Bang Chak to ฿5,000 for parents. Other frames work the PND 1 tax long-hand, test the 50/30/20 rule, claim a ฿5,125 PND 91 refund and compare every salary from ฿15,000 to ฿150,000.
Reviewed
Charts and networks
Fifty-eight penguins on one sheet, and twenty years of lottery draws on another.
Use case: Drawdy for presentations
For aquarium keepers
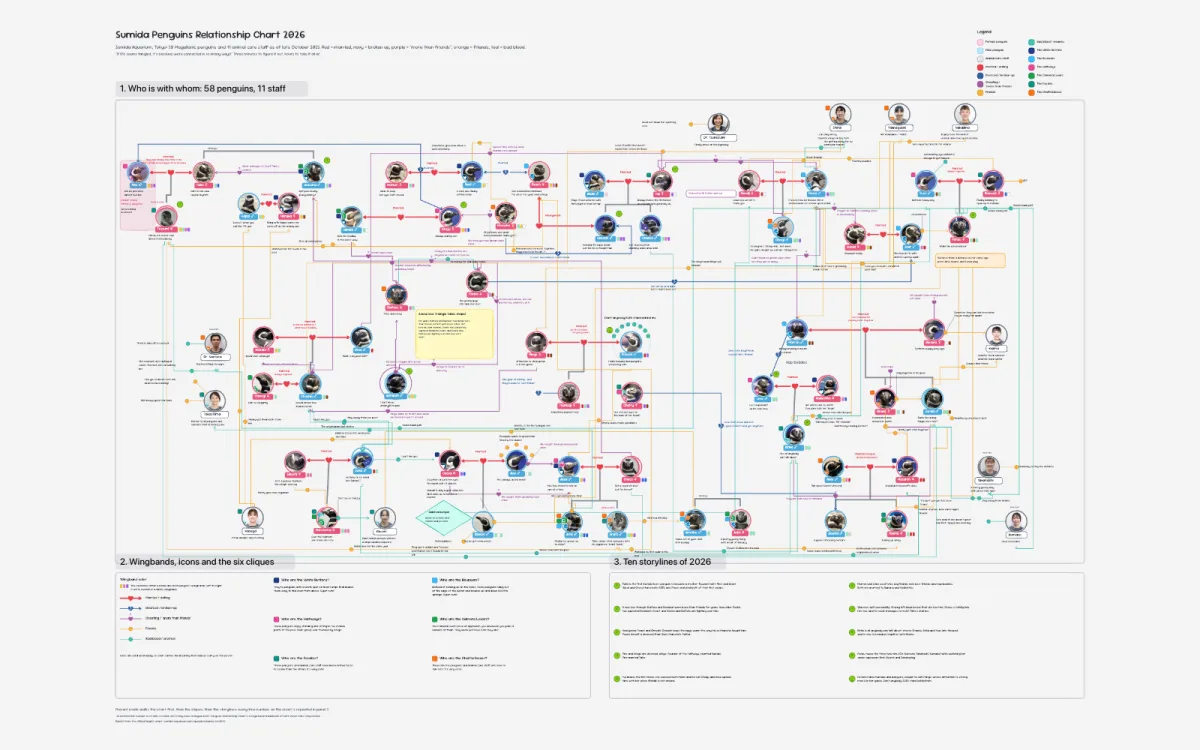
Sumida Penguins Relationship Chart 2026
Sumida Aquarium's own poster redrawn as a network: 58 Magellanic penguins and 11 keepers, with marriages in red, break-ups in navy, more-than-friends in purple, friendships in orange and bad blood in teal. Six named cliques, the 2025 hatchlings and every wingband colour are on it. Drawn after the aquarium's official English chart, a trademark of ORIX Real Estate Corporation.
Reviewed
For data analysts
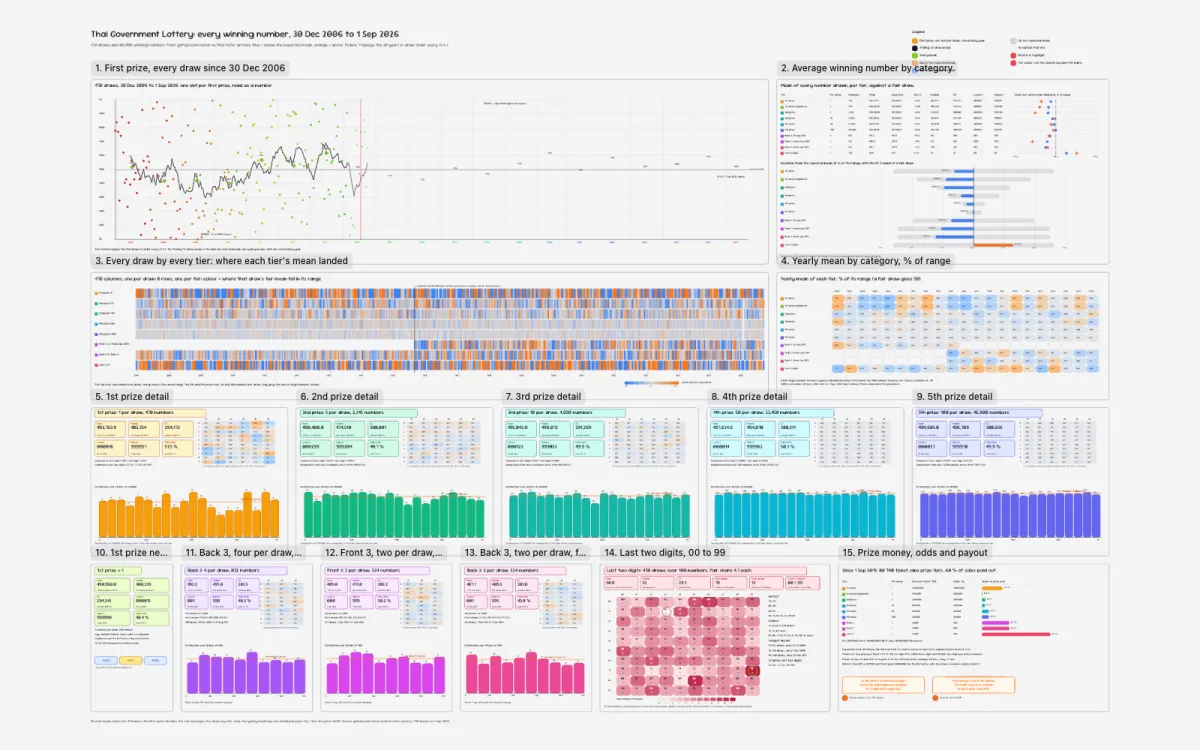
Thai Government Lottery: 470 draws, 20 years
Every winning number from 470 draws, 30 December 2006 to 1 September 2026, 80,000 numbers from the thai-lotto-archive dataset: the first-prize timeline replaying in draw order, each tier's mean against a fair draw with its 95 % band, a yearly heatmap and a digit-position panel per tier. The verdict: every tier sits inside its band, and the 60 % payout tariff gets the last word.
Reviewed
Simulations and proofs
Boards that play themselves, every moving part carrying its own keyframe track: a cellular automaton, a chaotic pendulum, six sorting algorithms, Fourier epicycles and five proofs.
Use case: Drawdy for teaching and tutoring
For computer scientists
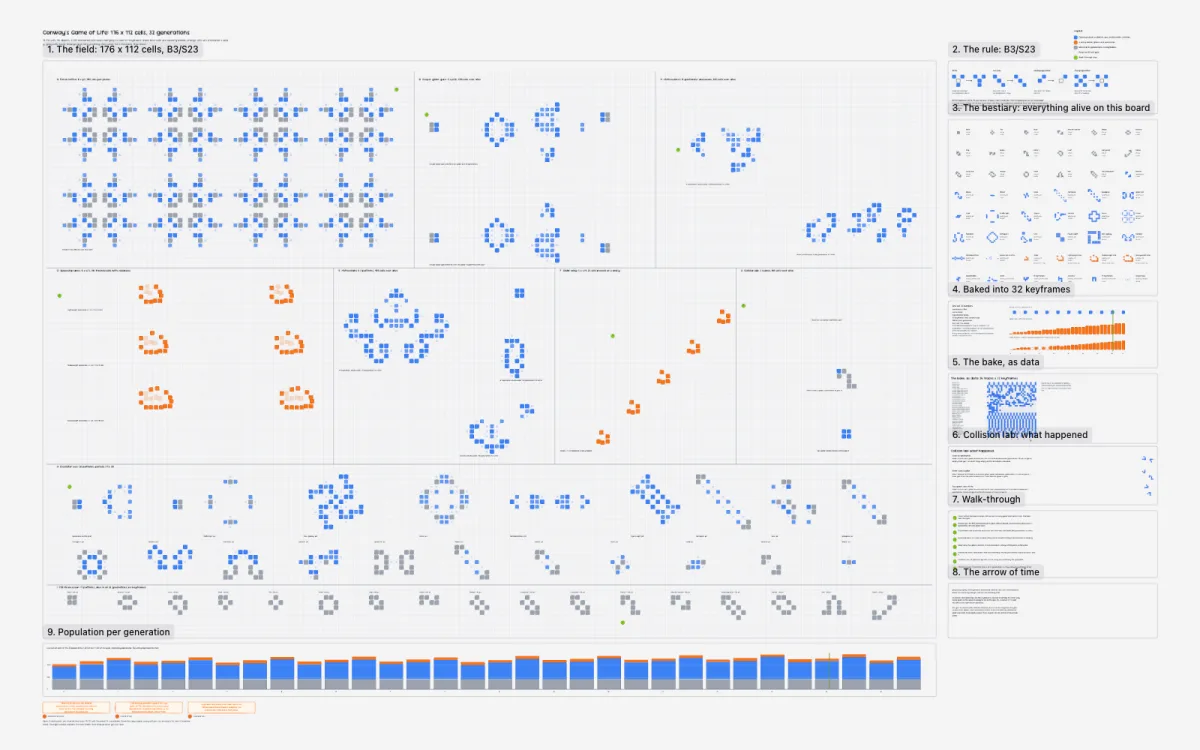
Conway's Game of Life: 32 generations
19,712 cells on a 176 by 112 grid stepping through 32 generations of B3/S23 on one shared clock, 5.6 seconds out and back: a pulsar lattice, two Gosper guns, methuselahs, spaceship lanes, a collision lab and a still-life museum. Watch the return leg to see which regions run backwards and which cannot.
Reviewed
For physicists
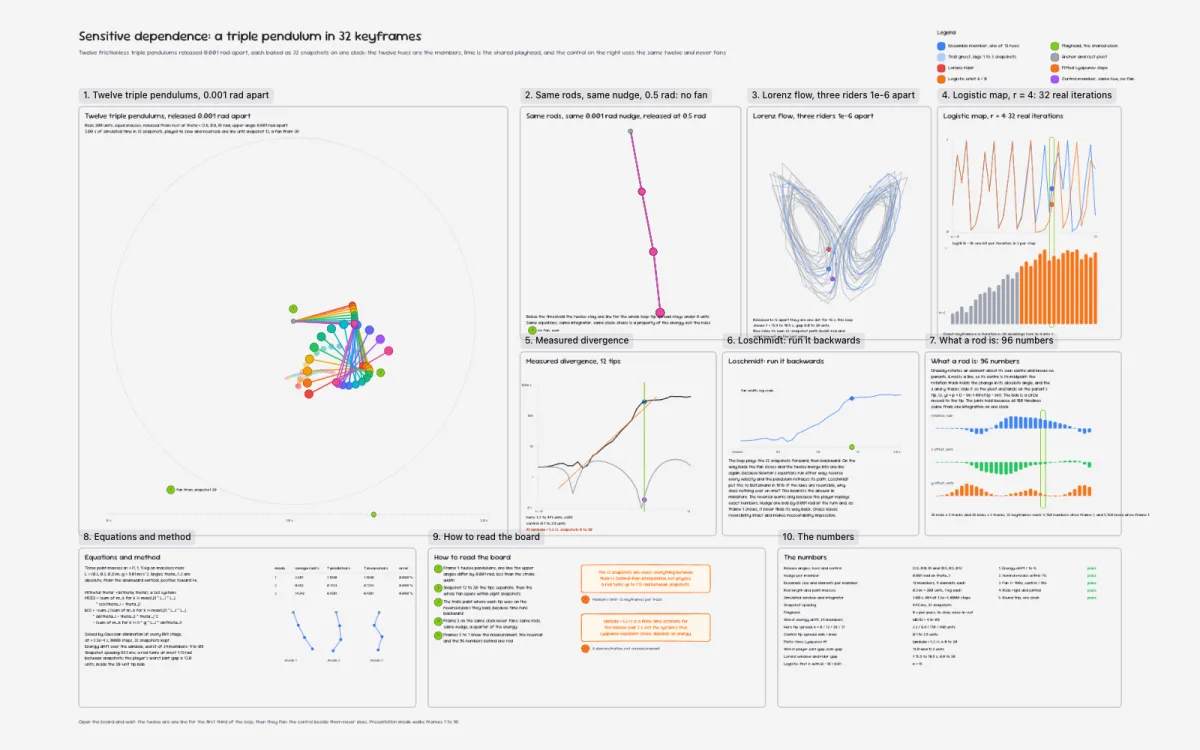
Sensitive dependence: a triple pendulum
Twelve triple pendulums released 0.001 radians apart hold one line for a third of the loop, then fan to 447 units, while a lower-energy control beside them never fans at all. RK4 at dt 2.5e-4, baked as 32 snapshots, with Lorenz riders, the logistic map and a Lyapunov fit of 5.3 per second on the same sheet.
Reviewed
For computer science students
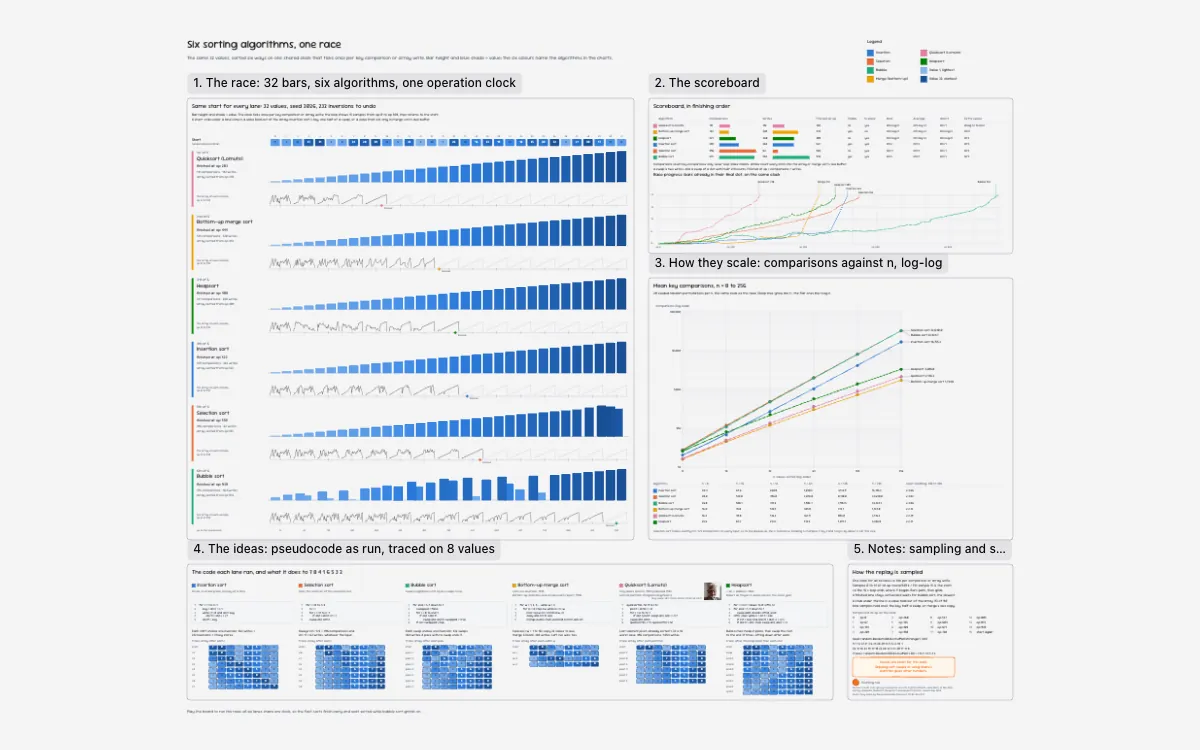
Six sorting algorithms, one race
Quicksort, bottom-up merge sort, heapsort, insertion, selection and bubble sort race the same 32 values (seed 2026, 232 inversions) on one clock that ticks once per key comparison or array write: quicksort finishes at op 283, bubble sort at op 939. A scoreboard, a log-log chart of mean comparisons for n = 8 to 256 and each lane's pseudocode traced on 8 values follow.
Reviewed
For maths teachers
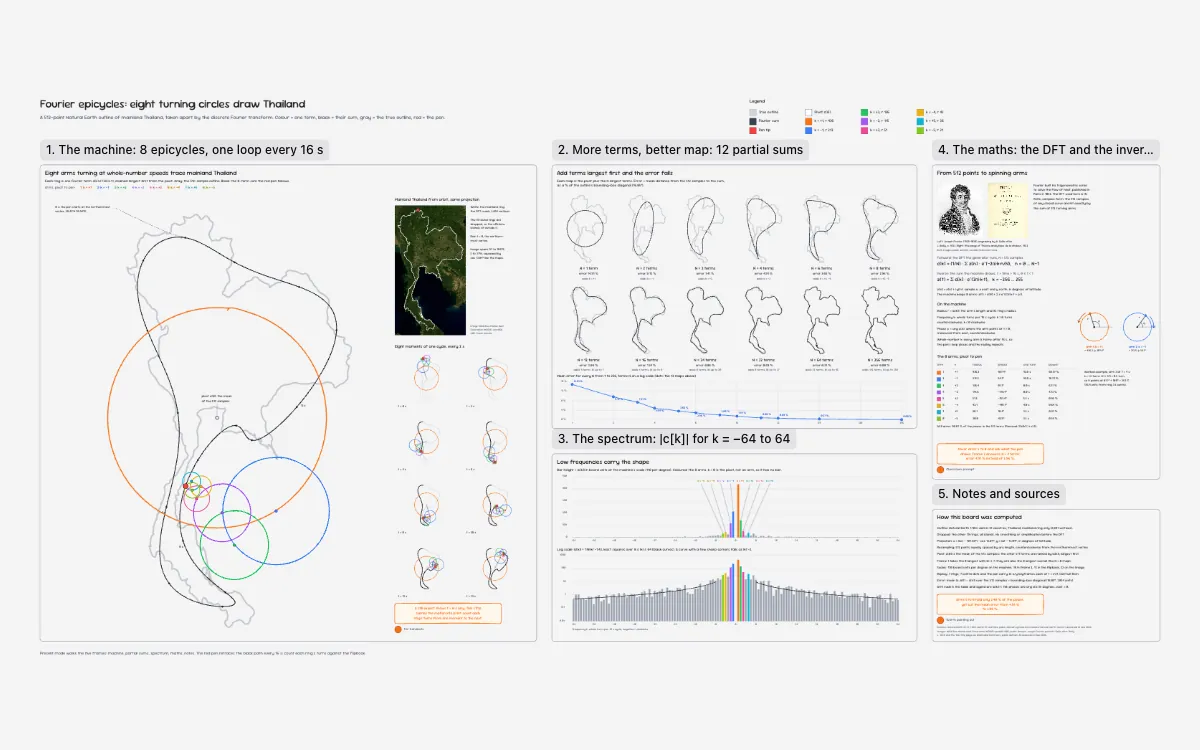
Fourier epicycles: eight turning circles draw Thailand
A 512-point Natural Earth outline of mainland Thailand, taken apart by the discrete Fourier transform and redrawn every 16 seconds by eight turning arms, with each arm's frequency, radius, phase and share of the power. Twelve partial sums show the mean error falling from 14.91 % with one term to 0.08 % with 256, beside the spectrum from k = -64 to 64, the DFT and its inverse sum, and a classroom prompt.
Reviewed
For geometry teachers
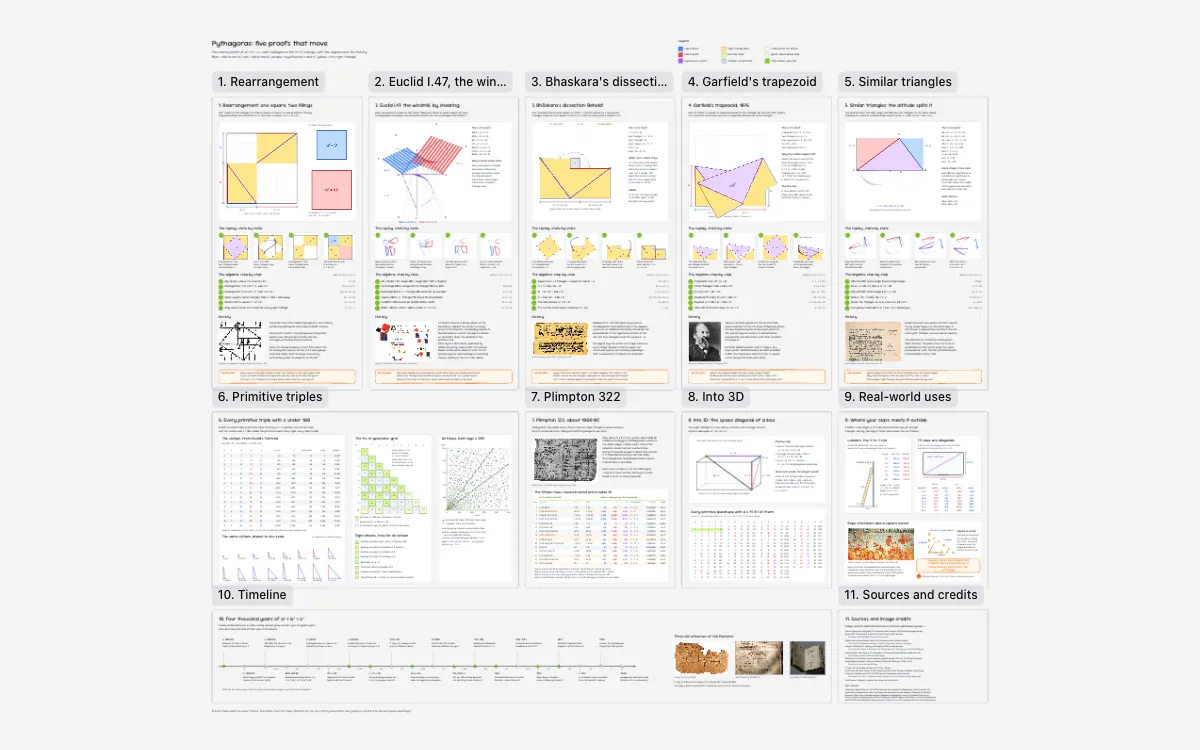
Pythagoras: five proofs that move
Five classic proofs of a² + b² = c², each replayed step by step on the 3-4-5 triangle: rearrangement, Euclid I.47's windmill, Bhāskara's 'Behold!' dissection, Garfield's 1876 trapezoid and similar triangles, with the algebra, the history and questions for the class. Later frames cover the 16 primitive triples with c under 100, Plimpton 322's fifteen rows, the space diagonal of a box, ladders and TV sizes, and a timeline from about 1800 BC.
Reviewed
Plans and drawings
A four-layer drone flight controller and Fallingwater from its measured drawings, each element draggable.
For electronics engineers
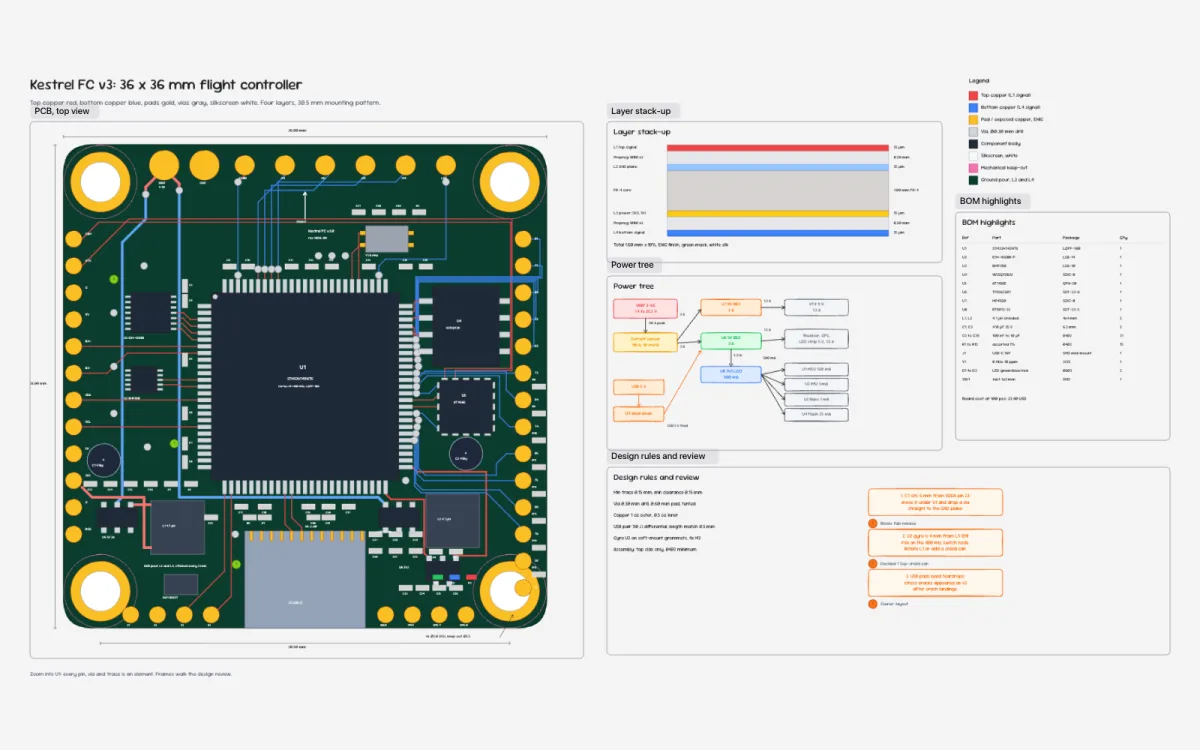
Kestrel FC v3: drone flight controller PCB
A 36 by 36 millimetre four-layer flight controller around an STM32H743, drawn pin by pin: top copper in red, bottom in blue, gold pads, vias and white silkscreen, every trace its own element. Layer stack-up and BOM highlights sit beside the board.
Reviewed
For architecture students
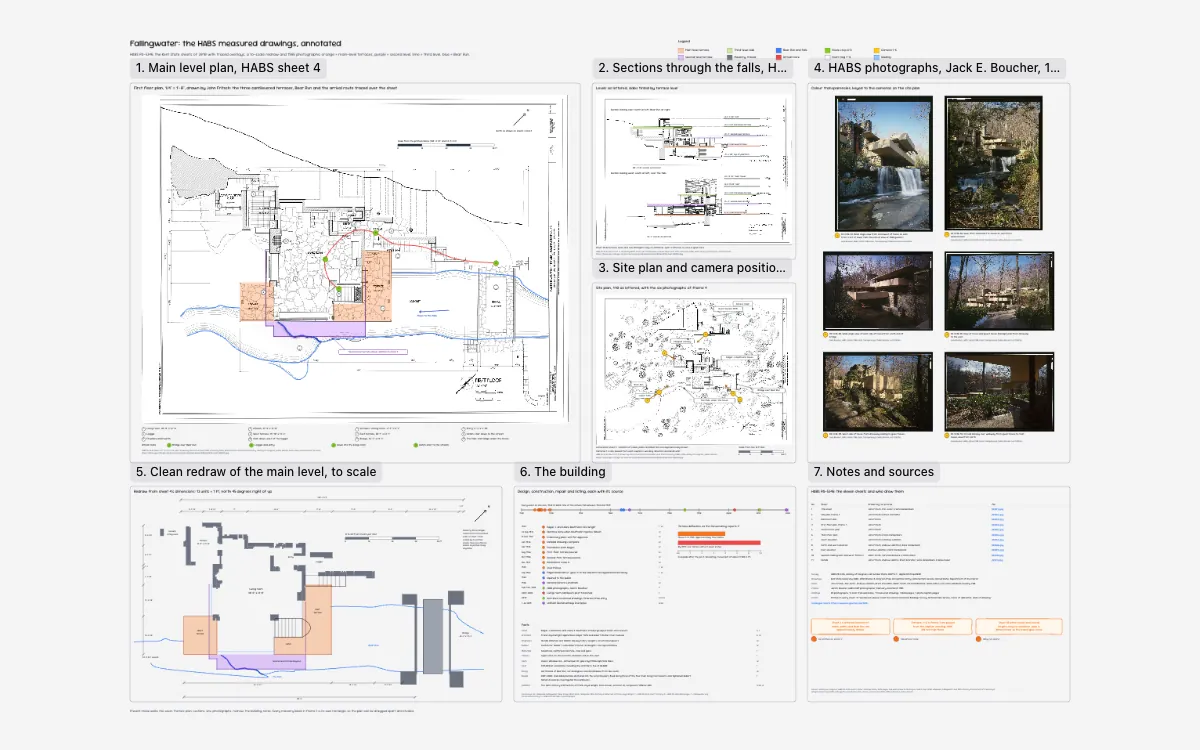
Fallingwater: the HABS measured drawings, annotated
Frank Lloyd Wright's Fallingwater read from the HABS PA-5346 measured drawings, made at Kent State in 2010: the main-level plan with its cantilevered terraces and arrival route traced over sheet 4, the sections through the falls with every level as lettered, and the site plan keyed to Jack Boucher's 1985 colour transparencies. A to-scale redraw whose 85 masonry blocks can be dragged apart and a sourced timeline from 1934 to the 2019 UNESCO listing follow.
Reviewed
Hobbies and everyday plans
A rail trip, a roast dinner for 12 timed to one oven, a dungeon with fog of war and the circle of fifths.
For first-time Japan travellers
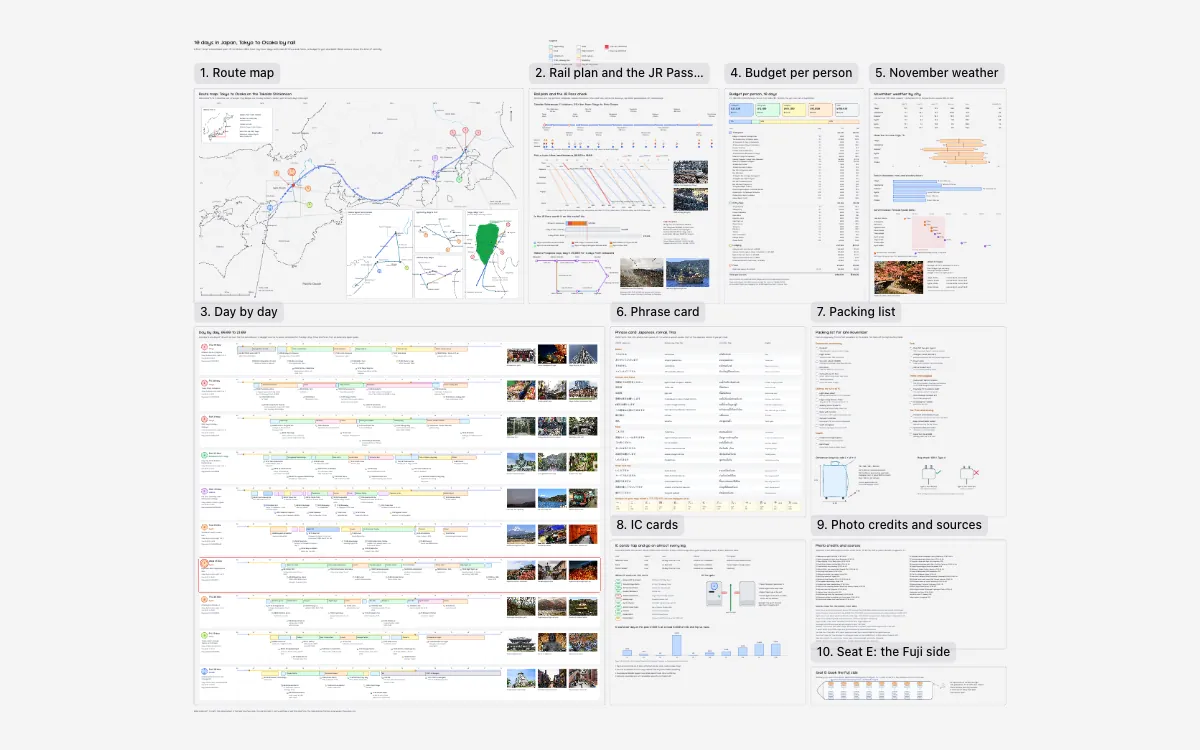
10 days in Japan, Tokyo to Osaka by rail
A first-timer's ten days by rail, 19 to 28 November 2026, from Tokyo through Kamakura, Hakone, Kyoto and Nara to Osaka: every day drawn hour by hour with real JR times and fares, and a JR Pass check where ¥19,690 of single tickets beats the ¥50,000 pass. A per-person budget of ¥190,939 (฿40,676), JMA November normals, autumn-leaf forecasts, a Japanese-Thai phrase card, IC cards and seat E for the Fuji view complete the plan.
Reviewed
For home cooks
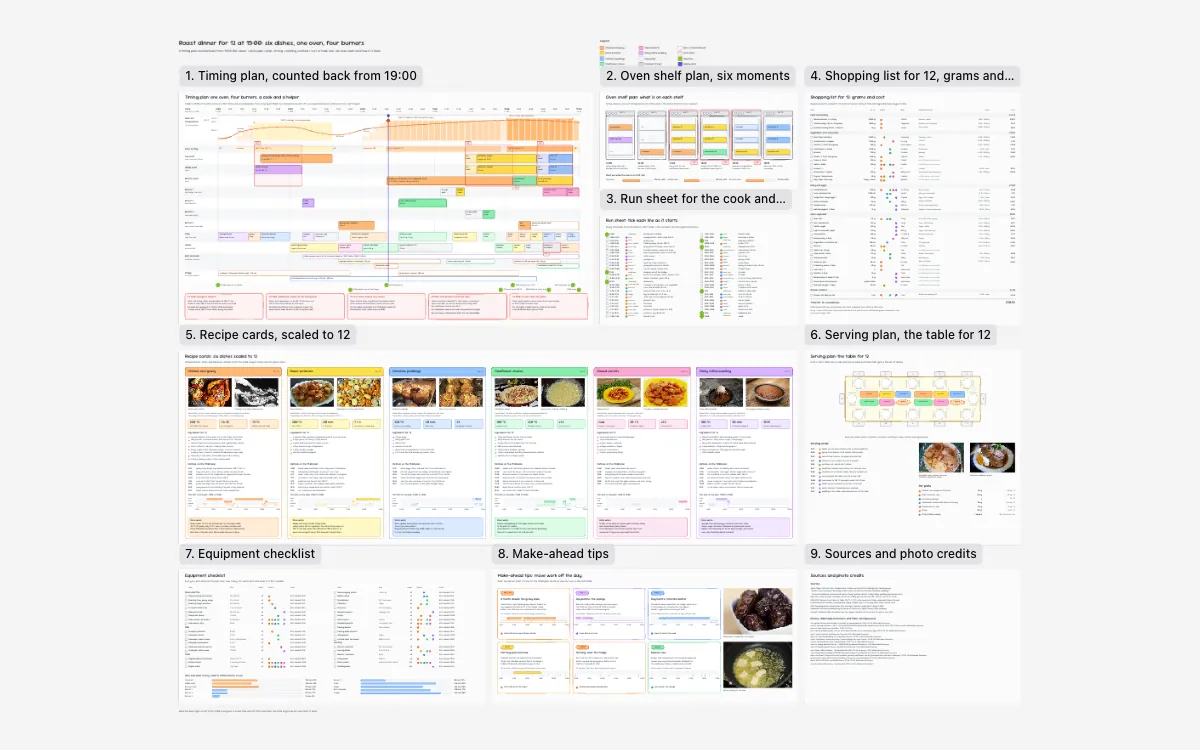
Roast dinner for 12: six dishes, one oven, four burners
A roast for 12, timed back from serving at 19:00 to a 14:00 start: chicken and gravy, roast potatoes, Yorkshire puddings, cauliflower cheese, glazed carrots and sticky toffee pudding share one oven, four burners, a cook and a helper, and five oven clashes are drawn with their fixes. Jamie Oliver's recipes scaled to 12, a shelf plan, run sheet, equipment checklist and a shopping list costed at £58.63 from ONS August 2026 prices sit alongside.
Reviewed
For tabletop game masters
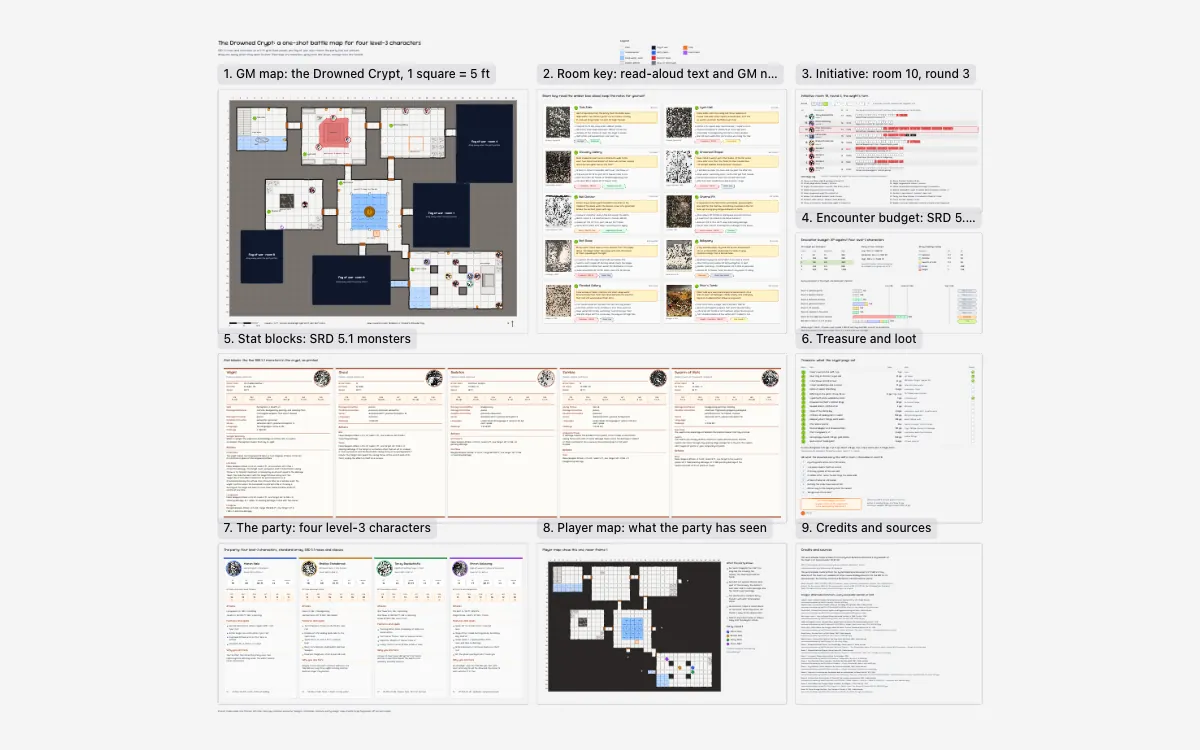
The Drowned Crypt: a one-shot battle map
A one-shot dungeon for four level-3 characters on a 5-ft grid, built on SRD 5.1 rules and monsters: the ten rooms of the Drowned Crypt with fog-of-war panels to drag off as doors open, read-aloud text and GM notes per room, and initiative paused on the wight's turn in round 3. Stat blocks, an SRD 5.2.1 XP budget, a treasure table, four character sheets and a player map without traps or monsters complete the kit.
Reviewed
For music theory students
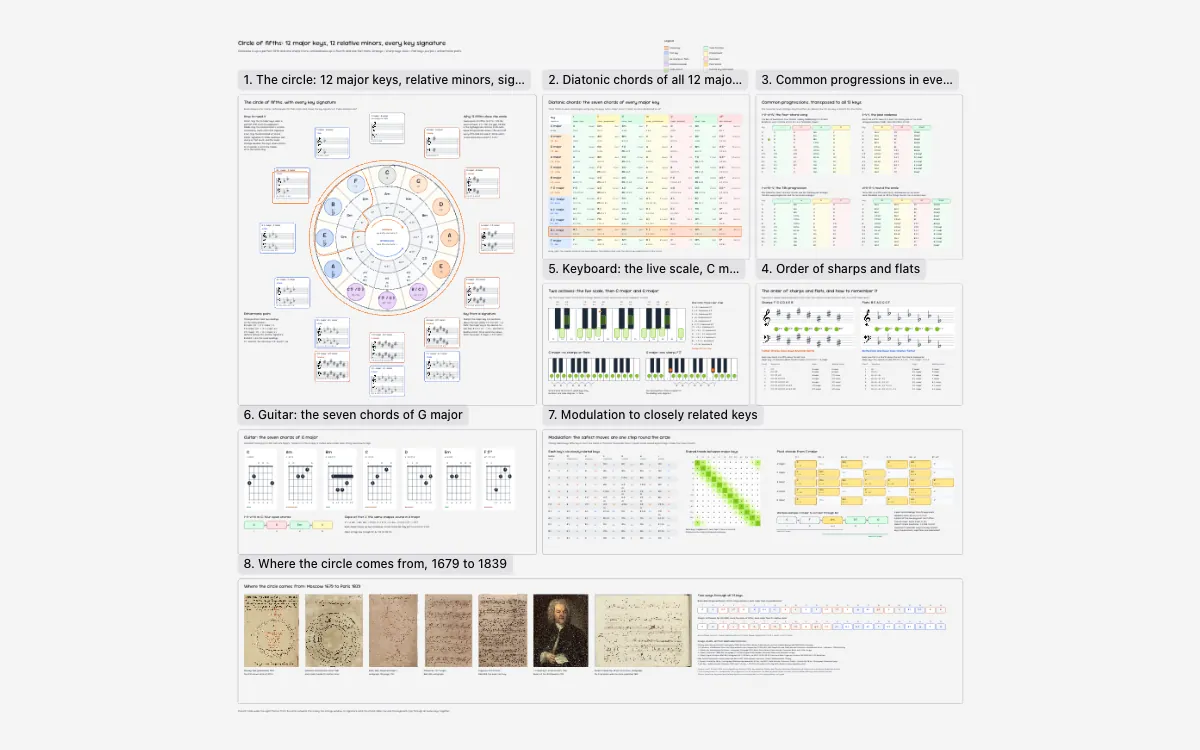
Circle of fifths: 12 major keys, 12 relative minors
The circle of fifths with all 12 major keys, their relative minors and diminished chords, every key signature in treble and bass clef, and how equal temperament absorbs the 23.46-cent Pythagorean comma. Further frames give the seven diatonic chords of every major key, four common progressions in all 12 keys, the order of sharps and flats, keyboard and guitar views, pivot-chord modulation and the circle's history from Diletsky's 1679 circle to Chopin's 1839 Preludes.
Reviewed
The canvas is open
Start your first board together
Connect your AI, bring your team, or just start drawing. The canvas opens with no signup.
Start drawing now